Exercise #5 Bronx Company provided the following fnancial statements for the years 2011 and 2012: 2011 53,000 87,000 346,000 432,000 918,000 1,113,000 2031.000 2012 31,000 Assets Cash Marketable securites Accounts receivable 528,000 683.000 1,242,000 1,398,000 2. 640,000 Inventories Current assets Net fixed assets Total Assets Liabilies & Equity Accounts payable Accrued expenses Bank borrowings Current liabilities Common stock Retained earnings Total libiltes & equity 413,000 226,000 100,000 739,000 100,00 1,192,000 2.031,000 627,000 314,000 235,000 1,176,000 100,000 1,364000 2.640.000 Note: For 2012, depreciation was P189,000 interest paid was P21,00; taves paid amounted to P114,000, and no dividends were paid. Required: Prepare a statement of cash flows using the indirect method. Create chars using Excel to highight the firm's flow of cash.
Exercise #5 Bronx Company provided the following fnancial statements for the years 2011 and 2012: 2011 53,000 87,000 346,000 432,000 918,000 1,113,000 2031.000 2012 31,000 Assets Cash Marketable securites Accounts receivable 528,000 683.000 1,242,000 1,398,000 2. 640,000 Inventories Current assets Net fixed assets Total Assets Liabilies & Equity Accounts payable Accrued expenses Bank borrowings Current liabilities Common stock Retained earnings Total libiltes & equity 413,000 226,000 100,000 739,000 100,00 1,192,000 2.031,000 627,000 314,000 235,000 1,176,000 100,000 1,364000 2.640.000 Note: For 2012, depreciation was P189,000 interest paid was P21,00; taves paid amounted to P114,000, and no dividends were paid. Required: Prepare a statement of cash flows using the indirect method. Create chars using Excel to highight the firm's flow of cash.

Survey of Accounting (Accounting I)
8th Edition
ISBN:9781305961883
Author:Carl Warren
Publisher:Carl Warren
Chapter9: Metric-analysis Of Financial Statements
Section: Chapter Questions
Problem 9.4.10P: Twenty metrics of liquidity, solvency, and profitability The comparative financial statements of...

Related questions
Question
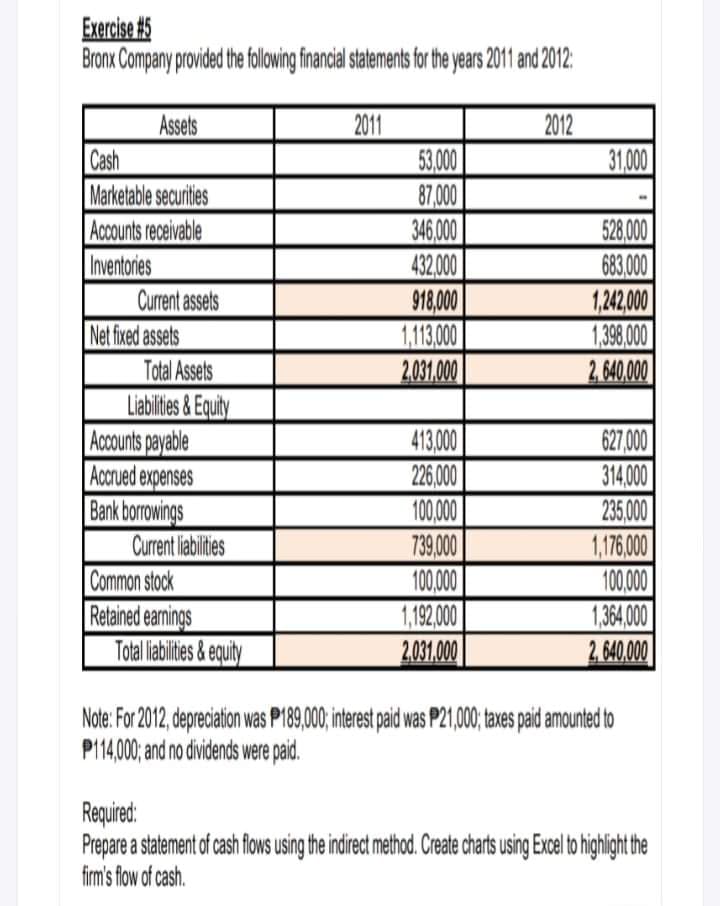
Transcribed Image Text:Exercise #5
Bronx Company provided the following financial statements for the years 2011 and 2012:
Assets
2012
31,000
2011
53,000
87,000
346,000
432,000
918,000
1,113,00
2031,000
Cash
Marketable securities
Accounts receivable
528,000
683,000
1,242,00
1,398,000
2,640,000
Inventories
Current assets
Net fixed assets
Total Assets
Liabilies &Equity
Accounts payable
Accrued expenses
Bank borwings
Current labilties
Common stock
Retained eamings
Totalliabilities & equity
413,000
226,000
100,000
739.000
100,000
1,192.000
2031.000
627,000
314000
235,000
1,176,000
100,000
1,364,00
2, 640,000
Note: For 2012, depreciation was P189,000 interest paid was P21,000; taxes paid amounted to
P114,000; and no dividends were paid.
Required:
Prepare a statement of cash flows using the indirect method. Create charts using Excel to highlight the
firm's flow of cash.
Expert Solution
This question has been solved!
Explore an expertly crafted, step-by-step solution for a thorough understanding of key concepts.

Step by step
Solved in 2 steps with 1 images

Knowledge Booster


Learn more about
Need a deep-dive on the concept behind this application? Look no further. Learn more about this topic, accounting and related others by exploring similar questions and additional content below.Recommended textbooks for you
Survey of Accounting (Accounting I)
Accounting
ISBN:
9781305961883
Author:
Carl Warren
Publisher:
Cengage Learning
Survey of Accounting (Accounting I)
Accounting
ISBN:
9781305961883
Author:
Carl Warren
Publisher:
Cengage Learning