FINANCIAL STATEMENT ANALYSIS-ASSESSMENT TOTAL POINTS = 93/93 The following are the balance sheet and income statement data of Jowie Corporation Balance Sheet Accounts (December 31) Cash 2007 2008 150,000 283,000 Marketable Securities Accounts Receivable, net Inventories Land 1,000,000 1,000,000 850,000 500,000 750,000 500,000 500,000 500,000 Building, net Machinery and equipment (net). Goodwill Deferred Charges Notes, Payable, Trade |Accounts Payable, Trade Expenses Payable Long-term Notes- Due 2018 15% Preferred Stock, P100 par |Common Stock, P10 par Retain Earnings 2008 Income Statement Accounts Sales Sales Returns and Allowances Inventory, Dec. 31, 2008 Inventory, Dec. 31, 2007 Purchases Selling Expenses Administrative Expenses(including Depreciation of P 250,000) Interest on Long-term Notes Income Taxes, 35% Additional Information: Dividends paid on preferred stock 550,000 1,700,000 400,000 500,000 1,500,000 400,000 100,000 90,000 100,000 150,000 610,000 790,000 40,000 60,000 2,500,000 500,000 2,250,000 500,000 1,500,000 1,500,000 250,000 523,000 5,250,000 250,000 500,000 750,000 2,750,000 400,000 600,000 250,000 1 75,000 Dividends paid on common stock 162,000 Market price per share on common 3 stock 18
FINANCIAL STATEMENT ANALYSIS-ASSESSMENT TOTAL POINTS = 93/93 The following are the balance sheet and income statement data of Jowie Corporation Balance Sheet Accounts (December 31) Cash 2007 2008 150,000 283,000 Marketable Securities Accounts Receivable, net Inventories Land 1,000,000 1,000,000 850,000 500,000 750,000 500,000 500,000 500,000 Building, net Machinery and equipment (net). Goodwill Deferred Charges Notes, Payable, Trade |Accounts Payable, Trade Expenses Payable Long-term Notes- Due 2018 15% Preferred Stock, P100 par |Common Stock, P10 par Retain Earnings 2008 Income Statement Accounts Sales Sales Returns and Allowances Inventory, Dec. 31, 2008 Inventory, Dec. 31, 2007 Purchases Selling Expenses Administrative Expenses(including Depreciation of P 250,000) Interest on Long-term Notes Income Taxes, 35% Additional Information: Dividends paid on preferred stock 550,000 1,700,000 400,000 500,000 1,500,000 400,000 100,000 90,000 100,000 150,000 610,000 790,000 40,000 60,000 2,500,000 500,000 2,250,000 500,000 1,500,000 1,500,000 250,000 523,000 5,250,000 250,000 500,000 750,000 2,750,000 400,000 600,000 250,000 1 75,000 Dividends paid on common stock 162,000 Market price per share on common 3 stock 18

Survey of Accounting (Accounting I)
8th Edition
ISBN:9781305961883
Author:Carl Warren
Publisher:Carl Warren
Chapter9: Metric-analysis Of Financial Statements
Section: Chapter Questions
Problem 9.17E: Profitability metrics The following selected data were taken from the financial statements of The...

Related questions
Question
100%
Evaluate the firm’s profitability for 2008 by computing:
a. Return on Common Stockholders’ Equity.
b. Earnings Per Share (EPS)
c. Price-earnings Ratio
d. Pay-out Ratio to Common Shares
e. Dividend Yield Per Share on Common Stock
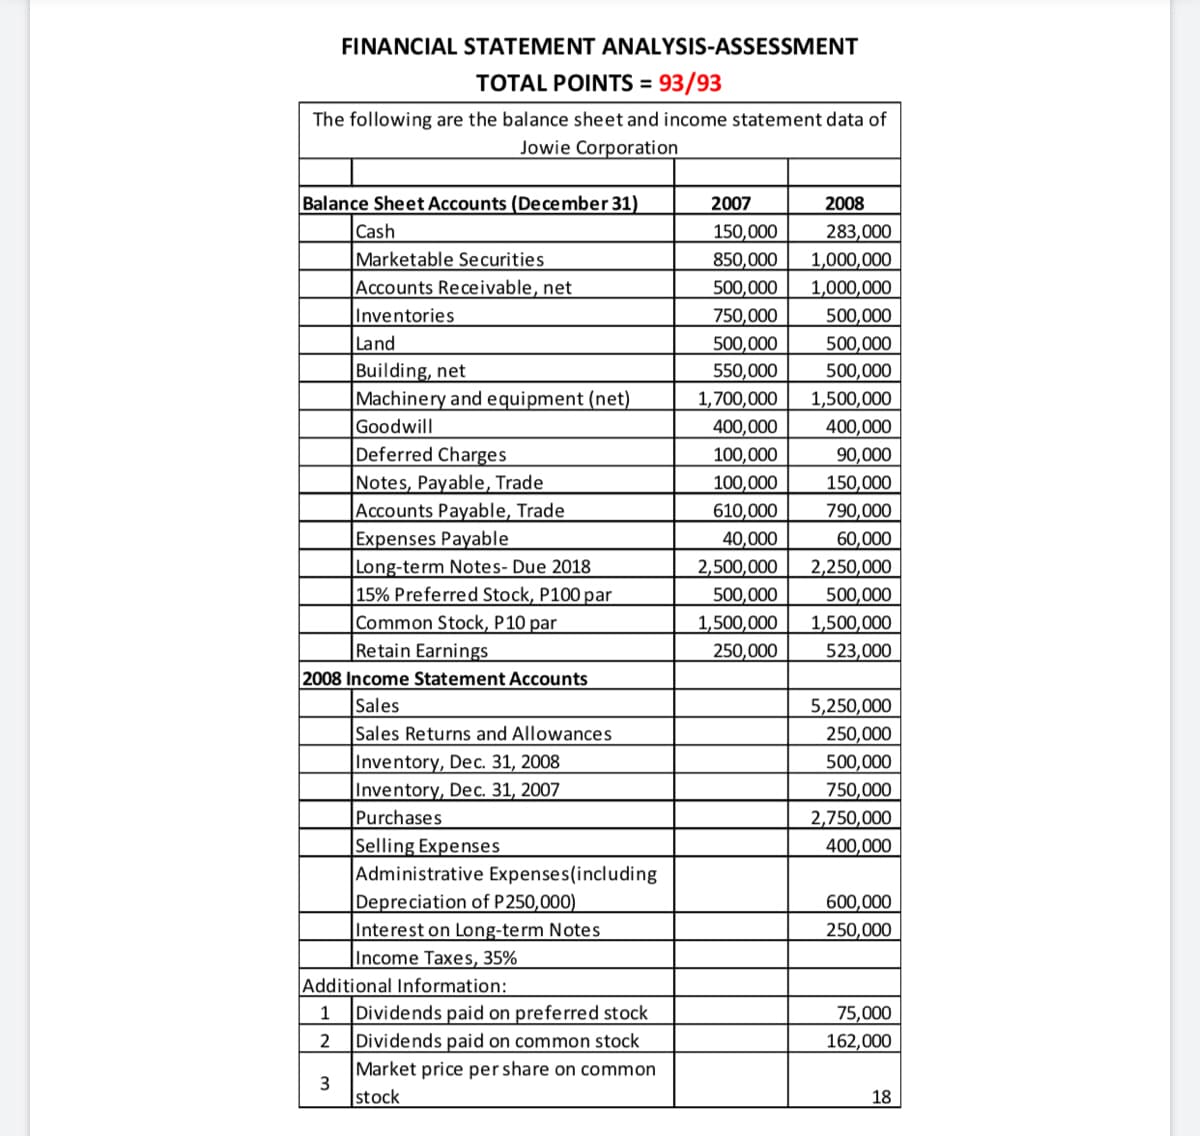
Transcribed Image Text:FINANCIAL STATEMENT ANALYSIS-ASSESSMENT
TOTAL POINTS = 93/93
The following are the balance sheet and income statement data of
Jowie Corporation
Balance Sheet Accounts (De cember 31)
2007
2008
Cash
283,000
1,000,000
150,000
Marketable Securities
Accounts Receivable, net
850,000
500,000
1,000,000
500,000
Inventories
Land
750,000
500,000
500,000
Building, net
Machinery and equipment (net)
Goodwill
|Deferred Charges
Notes, Payable, Trade
Accounts Payable, Trade
Expenses Payable
Long-term Notes- Due 2018
15% Preferred Stock, P100 par
Common Stock, P10 par
Retain Earnings
2008 Income Statement Accounts
Sales
550,000
500,000
1,700,000
1,500,000
400,000
400,000
100,000
100,000
610,000
40,000
90,000
150,000
790,000
60,000
2,500,000
2,250,000
500,000
500,000
1,500,000
1,500,000
250,000
523,000
5,250,000
250,000
Sales Returns and Allowances
Inventory, Dec. 31, 2008
Inventory, Dec. 31, 2007
Purchases
Selling Expenses
Administrative Expenses(including
Depreciation of P250,000)
Interest on Long-term Notes
Income Taxes, 35%
Additional Information:
Dividends paid on preferred stock
Dividends paid on common stock
500,000
750,000
2,750,000
400,000
600,000
250,000
1
75,000
2
162,000
Market price per share on common
3
stock
18
Expert Solution
This question has been solved!
Explore an expertly crafted, step-by-step solution for a thorough understanding of key concepts.

Step by step
Solved in 2 steps

Knowledge Booster


Learn more about
Need a deep-dive on the concept behind this application? Look no further. Learn more about this topic, accounting and related others by exploring similar questions and additional content below.Recommended textbooks for you
Survey of Accounting (Accounting I)
Accounting
ISBN:
9781305961883
Author:
Carl Warren
Publisher:
Cengage Learning

Principles of Accounting Volume 1
Accounting
ISBN:
9781947172685
Author:
OpenStax
Publisher:
OpenStax College
Survey of Accounting (Accounting I)
Accounting
ISBN:
9781305961883
Author:
Carl Warren
Publisher:
Cengage Learning
Principles of Accounting Volume 1
Accounting
ISBN:
9781947172685
Author:
OpenStax
Publisher:
OpenStax College