Exercise 7-47 Algo A manufacturing process produces steel rods in batches of 3,300. The firm believes that the percent of defective items generated by this process is 6.6%. a. Calculate the centerline, the upper control limit (UCL), and the lower control limit (LCL) for the p chart. (Round your answers to 3 decimal places.) Centerline Upper Control Limit Lower Control Limit b. An engineer inspects the next batch of 3,300 steel rods and finds that 7.8% are defective. Is the manufacturing process under control? O Yes, because the sample proportion lies within the control limits. Yes, because the sample proportion lies below the lower control limit. O No, because the sample proportion lies between the upper and lower control limits. O No, because the sample proportion lies below the lower control limit.
Exercise 7-47 Algo A manufacturing process produces steel rods in batches of 3,300. The firm believes that the percent of defective items generated by this process is 6.6%. a. Calculate the centerline, the upper control limit (UCL), and the lower control limit (LCL) for the p chart. (Round your answers to 3 decimal places.) Centerline Upper Control Limit Lower Control Limit b. An engineer inspects the next batch of 3,300 steel rods and finds that 7.8% are defective. Is the manufacturing process under control? O Yes, because the sample proportion lies within the control limits. Yes, because the sample proportion lies below the lower control limit. O No, because the sample proportion lies between the upper and lower control limits. O No, because the sample proportion lies below the lower control limit.

MATLAB: An Introduction with Applications
6th Edition
ISBN:9781119256830
Author:Amos Gilat
Publisher:Amos Gilat
Chapter1: Starting With Matlab
Section: Chapter Questions
Problem 1P

Related questions
Question
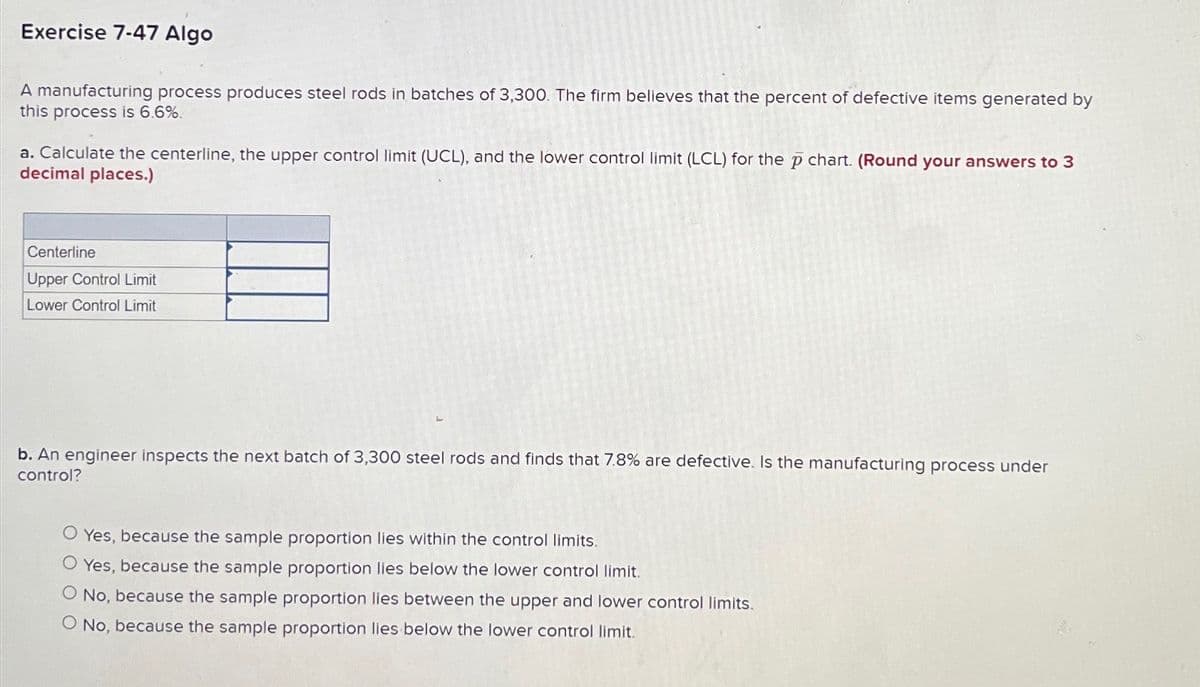
Transcribed Image Text:Exercise 7-47 Algo
A manufacturing process produces steel rods in batches of 3,300. The firm believes that the percent of defective items generated by
this process is 6.6%.
a. Calculate the centerline, the upper control limit (UCL), and the lower control limit (LCL) for the p chart. (Round your answers to 3
decimal places.)
Centerline
Upper Control Limit
Lower Control Limit
b. An engineer inspects the next batch of 3,300 steel rods and finds that 7.8% are defective. Is the manufacturing process under
control?
O Yes, because the sample proportion lies within the control limits.
Yes, because the sample proportion lies below the lower control limit.
O No, because the sample proportion lies between the upper and lower control limits.
O No, because the sample proportion lies below the lower control limit.
Expert Solution
This question has been solved!
Explore an expertly crafted, step-by-step solution for a thorough understanding of key concepts.

Step by step
Solved in 2 steps

Recommended textbooks for you
MATLAB: An Introduction with Applications
Statistics
ISBN:
9781119256830
Author:
Amos Gilat
Publisher:
John Wiley & Sons Inc

Probability and Statistics for Engineering and th…
Statistics
ISBN:
9781305251809
Author:
Jay L. Devore
Publisher:
Cengage Learning

Statistics for The Behavioral Sciences (MindTap C…
Statistics
ISBN:
9781305504912
Author:
Frederick J Gravetter, Larry B. Wallnau
Publisher:
Cengage Learning
MATLAB: An Introduction with Applications
Statistics
ISBN:
9781119256830
Author:
Amos Gilat
Publisher:
John Wiley & Sons Inc
Probability and Statistics for Engineering and th…
Statistics
ISBN:
9781305251809
Author:
Jay L. Devore
Publisher:
Cengage Learning
Statistics for The Behavioral Sciences (MindTap C…
Statistics
ISBN:
9781305504912
Author:
Frederick J Gravetter, Larry B. Wallnau
Publisher:
Cengage Learning

Elementary Statistics: Picturing the World (7th E…
Statistics
ISBN:
9780134683416
Author:
Ron Larson, Betsy Farber
Publisher:
PEARSON

The Basic Practice of Statistics
Statistics
ISBN:
9781319042578
Author:
David S. Moore, William I. Notz, Michael A. Fligner
Publisher:
W. H. Freeman

Introduction to the Practice of Statistics
Statistics
ISBN:
9781319013387
Author:
David S. Moore, George P. McCabe, Bruce A. Craig
Publisher:
W. H. Freeman