Experiment No: 10 SPECTROPHOTOMETRIC DETERMINATION OF IRON RESULTS AND INTERPRETATIONS Table 10.1. Maximum wavelength for Fe-phenanthroline complex. Parameter Value Maximum wavelength, nm 496.7 Table 10.2. Calibration curve for Fe-phenanalina namalex. Concentration, ppm Absorpance at 0.00 0.000 0.216 0.414 0.612 1.00 2.00 3.00 4.00 5.00 0.790 0.984 Equation of the Best-Fit Line (y = mx + b) Coefficient of Determination (r*) Table 10.3. Determination of the concentration of the unknown. Trial 1 Parameter Trial 2 Absorbance of Unknown Solution at 2.. Concentration of the Unknown Solution Average Concentration of the Unknown Solution 0.553 0.554 Note: Provide the calibration curve (with appropriate title, axis labels, etc.) and the calculation of the concentration of the unknown solution. Signature:
Experiment No: 10 SPECTROPHOTOMETRIC DETERMINATION OF IRON RESULTS AND INTERPRETATIONS Table 10.1. Maximum wavelength for Fe-phenanthroline complex. Parameter Value Maximum wavelength, nm 496.7 Table 10.2. Calibration curve for Fe-phenanalina namalex. Concentration, ppm Absorpance at 0.00 0.000 0.216 0.414 0.612 1.00 2.00 3.00 4.00 5.00 0.790 0.984 Equation of the Best-Fit Line (y = mx + b) Coefficient of Determination (r*) Table 10.3. Determination of the concentration of the unknown. Trial 1 Parameter Trial 2 Absorbance of Unknown Solution at 2.. Concentration of the Unknown Solution Average Concentration of the Unknown Solution 0.553 0.554 Note: Provide the calibration curve (with appropriate title, axis labels, etc.) and the calculation of the concentration of the unknown solution. Signature:

Principles of Instrumental Analysis
7th Edition
ISBN:9781305577213
Author:Douglas A. Skoog, F. James Holler, Stanley R. Crouch
Publisher:Douglas A. Skoog, F. James Holler, Stanley R. Crouch
Chapter14: Applications Of Ultraviolet-visible Molecular Absorption Spectrometry
Section: Chapter Questions
Problem 14.23QAP

Related questions

Question
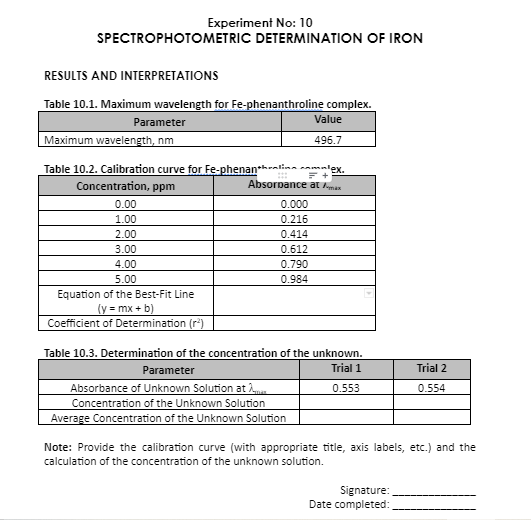
Transcribed Image Text:Experiment No: 10
SPECTROPHOTOMETRIC DETERMINATION OF IRON
RESULTS AND INTERPRETATIONS
Table 10.1. Maximum wavelength for Fe-phenanthroline complex.
Parameter
Value
Maximum wavelength, nm
496.7
Table 10.2. Calibration curve for Fe-phenan*hralina co
lex.
Absorpance at man
Concentration, ppm
0.00
0.000
1.00
0.216
2.00
0.414
3.00
0.612
4.00
0.790
5.00
0.984
Equation of the Best-Fit Line
(y = mx + b)
Coefficient of Determination (r*)
Table 10.3. Determination of the concentration of the unknown.
Trial 1
Parameter
Trial 2
Absorbance of Unknown Solution at
Concentration of the Unknown Solution
Average Concentration of the Unknown Solution
0.553
0.554
Note: Provide the calibration curve (with appropriate title, axis labels, etc.) and the
calculation of the concentration of the unknown solution.
Signature:
Date completed:
Expert Solution
This question has been solved!
Explore an expertly crafted, step-by-step solution for a thorough understanding of key concepts.

Step by step
Solved in 4 steps with 2 images

Knowledge Booster


Learn more about
Need a deep-dive on the concept behind this application? Look no further. Learn more about this topic, chemistry and related others by exploring similar questions and additional content below.Recommended textbooks for you
Principles of Instrumental Analysis
Chemistry
ISBN:
9781305577213
Author:
Douglas A. Skoog, F. James Holler, Stanley R. Crouch
Publisher:
Cengage Learning

Principles of Instrumental Analysis
Chemistry
ISBN:
9781305577213
Author:
Douglas A. Skoog, F. James Holler, Stanley R. Crouch
Publisher:
Cengage Learning