Explain how you filled in the frequency table and answer these questions. 1. What fraction of students prefer ice cream? 2. What fraction of male students prefer yogurt? 3. What fraction of female students prefer yogurt?
Explain how you filled in the frequency table and answer these questions. 1. What fraction of students prefer ice cream? 2. What fraction of male students prefer yogurt? 3. What fraction of female students prefer yogurt?

Chapter6: Systems Of Equations And Inequalities
Section: Chapter Questions
Problem 17PS: Cholesterol Cholesterol in human blood is necessary, but too much can lead to health problems. There...

Related questions
Question
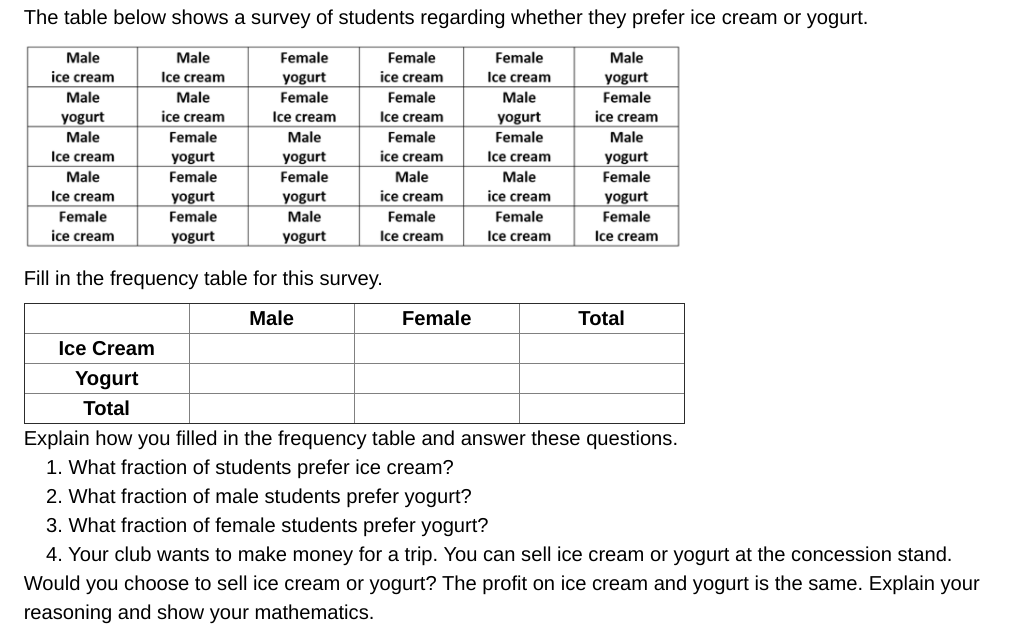
Transcribed Image Text:The table below shows a survey of students regarding whether they prefer ice cream or yogurt.
Male
Male
Female
Female
Female
Male
ice cream
Ice cream
yogurt
ice cream
Ice cream
yogurt
Male
Male
Female
Female
Male
Female
yogurt
ice cream
Ice cream
Ice cream
yogurt
ice cream
Male
Female
Male
Female
Female
Male
Ice cream
yogurt
yogurt
ice cream
Ice cream
yogurt
Male
Female
Female
Male
ice cream
Male
Female
Ice cream
yogurt
Male
ice cream
yogurt
yogurt
Female
Female
Female
Female
Female
ice cream
yogurt
yogurt
Ice cream
Ice cream
Ice cream
Fill in the frequency table for this survey.
Male
Female
Total
Ice Cream
Yogurt
Total
Explain how you filled in the frequency table and answer these questions.
1. What fraction of students prefer ice cream?
2. What fraction of male students prefer yogurt?
3. What fraction of female students prefer yogurt?
4. Your club wants to make money for a trip. You can sell ice cream or yogurt at the concession stand.
Would you choose to sell ice cream or yogurt? The profit on ice cream and yogurt is the same. Explain your
reasoning and show your mathematics.
Expert Solution
This question has been solved!
Explore an expertly crafted, step-by-step solution for a thorough understanding of key concepts.

This is a popular solution!

Trending now
This is a popular solution!

Step by step
Solved in 2 steps

Knowledge Booster


Learn more about
Need a deep-dive on the concept behind this application? Look no further. Learn more about this topic, statistics and related others by exploring similar questions and additional content below.Recommended textbooks for you