Explain what is measured by the sample standard a sta with S а. deviation. b. Compute the estimated standard error for the sample mean and explain what is measured by the а. Но for ро fo b. H standard error 3. Find the estimated standard error for the sample mean for each of the following samples. a. n 9 with SS = 1152 b. n= 16 with SS= c. n = 25 with SS = 600 b 540 с. 4. Explain why t distributions tend to be flatter and more spread out than the normal distribution. 10. Ar 5 Find the t values that form the boundaries of the criti- cal region for a two-tailed test with a = .05 for each of the following sample sizes: = 4 0R b. n = 15 0 fro ad tre Wi а. п — a. DIC9R с. п %3D 24 6. Find the t value that forms the boundary of the critical region in the right-hand tail for a one-tailed test with a = .01 for each of the following sample sizes. TE a. п 3D 10 b. n 20 c. n 30 1. The following sample of n = 4 scores was obtained from a population with unknown parameters. Scores: 2, 2, 6, 2 11. a. Compute the sample mean and standard deviation. (Note that these are descriptive values that sum- marize the sample data.) D. Compute the estimated standard error for M. forantial value that describes
Explain what is measured by the sample standard a sta with S а. deviation. b. Compute the estimated standard error for the sample mean and explain what is measured by the а. Но for ро fo b. H standard error 3. Find the estimated standard error for the sample mean for each of the following samples. a. n 9 with SS = 1152 b. n= 16 with SS= c. n = 25 with SS = 600 b 540 с. 4. Explain why t distributions tend to be flatter and more spread out than the normal distribution. 10. Ar 5 Find the t values that form the boundaries of the criti- cal region for a two-tailed test with a = .05 for each of the following sample sizes: = 4 0R b. n = 15 0 fro ad tre Wi а. п — a. DIC9R с. п %3D 24 6. Find the t value that forms the boundary of the critical region in the right-hand tail for a one-tailed test with a = .01 for each of the following sample sizes. TE a. п 3D 10 b. n 20 c. n 30 1. The following sample of n = 4 scores was obtained from a population with unknown parameters. Scores: 2, 2, 6, 2 11. a. Compute the sample mean and standard deviation. (Note that these are descriptive values that sum- marize the sample data.) D. Compute the estimated standard error for M. forantial value that describes

Glencoe Algebra 1, Student Edition, 9780079039897, 0079039898, 2018
18th Edition
ISBN:9780079039897
Author:Carter
Publisher:Carter
Chapter10: Statistics
Section10.4: Distributions Of Data
Problem 19PFA

Related questions

Concept explainers
Contingency Table
A contingency table can be defined as the visual representation of the relationship between two or more categorical variables that can be evaluated and registered. It is a categorical version of the scatterplot, which is used to investigate the linear relationship between two variables. A contingency table is indeed a type of frequency distribution table that displays two variables at the same time.
Binomial Distribution
Binomial is an algebraic expression of the sum or the difference of two terms. Before knowing about binomial distribution, we must know about the binomial theorem.
Topic Video
Question
Number 5
Transcribed Image Text:Explain what is measured by the sample standard
a sta
with S
а.
deviation.
b. Compute the estimated standard error for the
sample mean and explain what is measured by the
а. Но
for
ро
fo
b. H
standard error
3. Find the estimated standard error for the sample mean
for each of the following samples.
a. n 9 with SS = 1152
b. n= 16 with SS=
c. n = 25 with SS = 600
b
540
с.
4. Explain why t distributions tend to be flatter and more
spread out than the normal distribution.
10. Ar
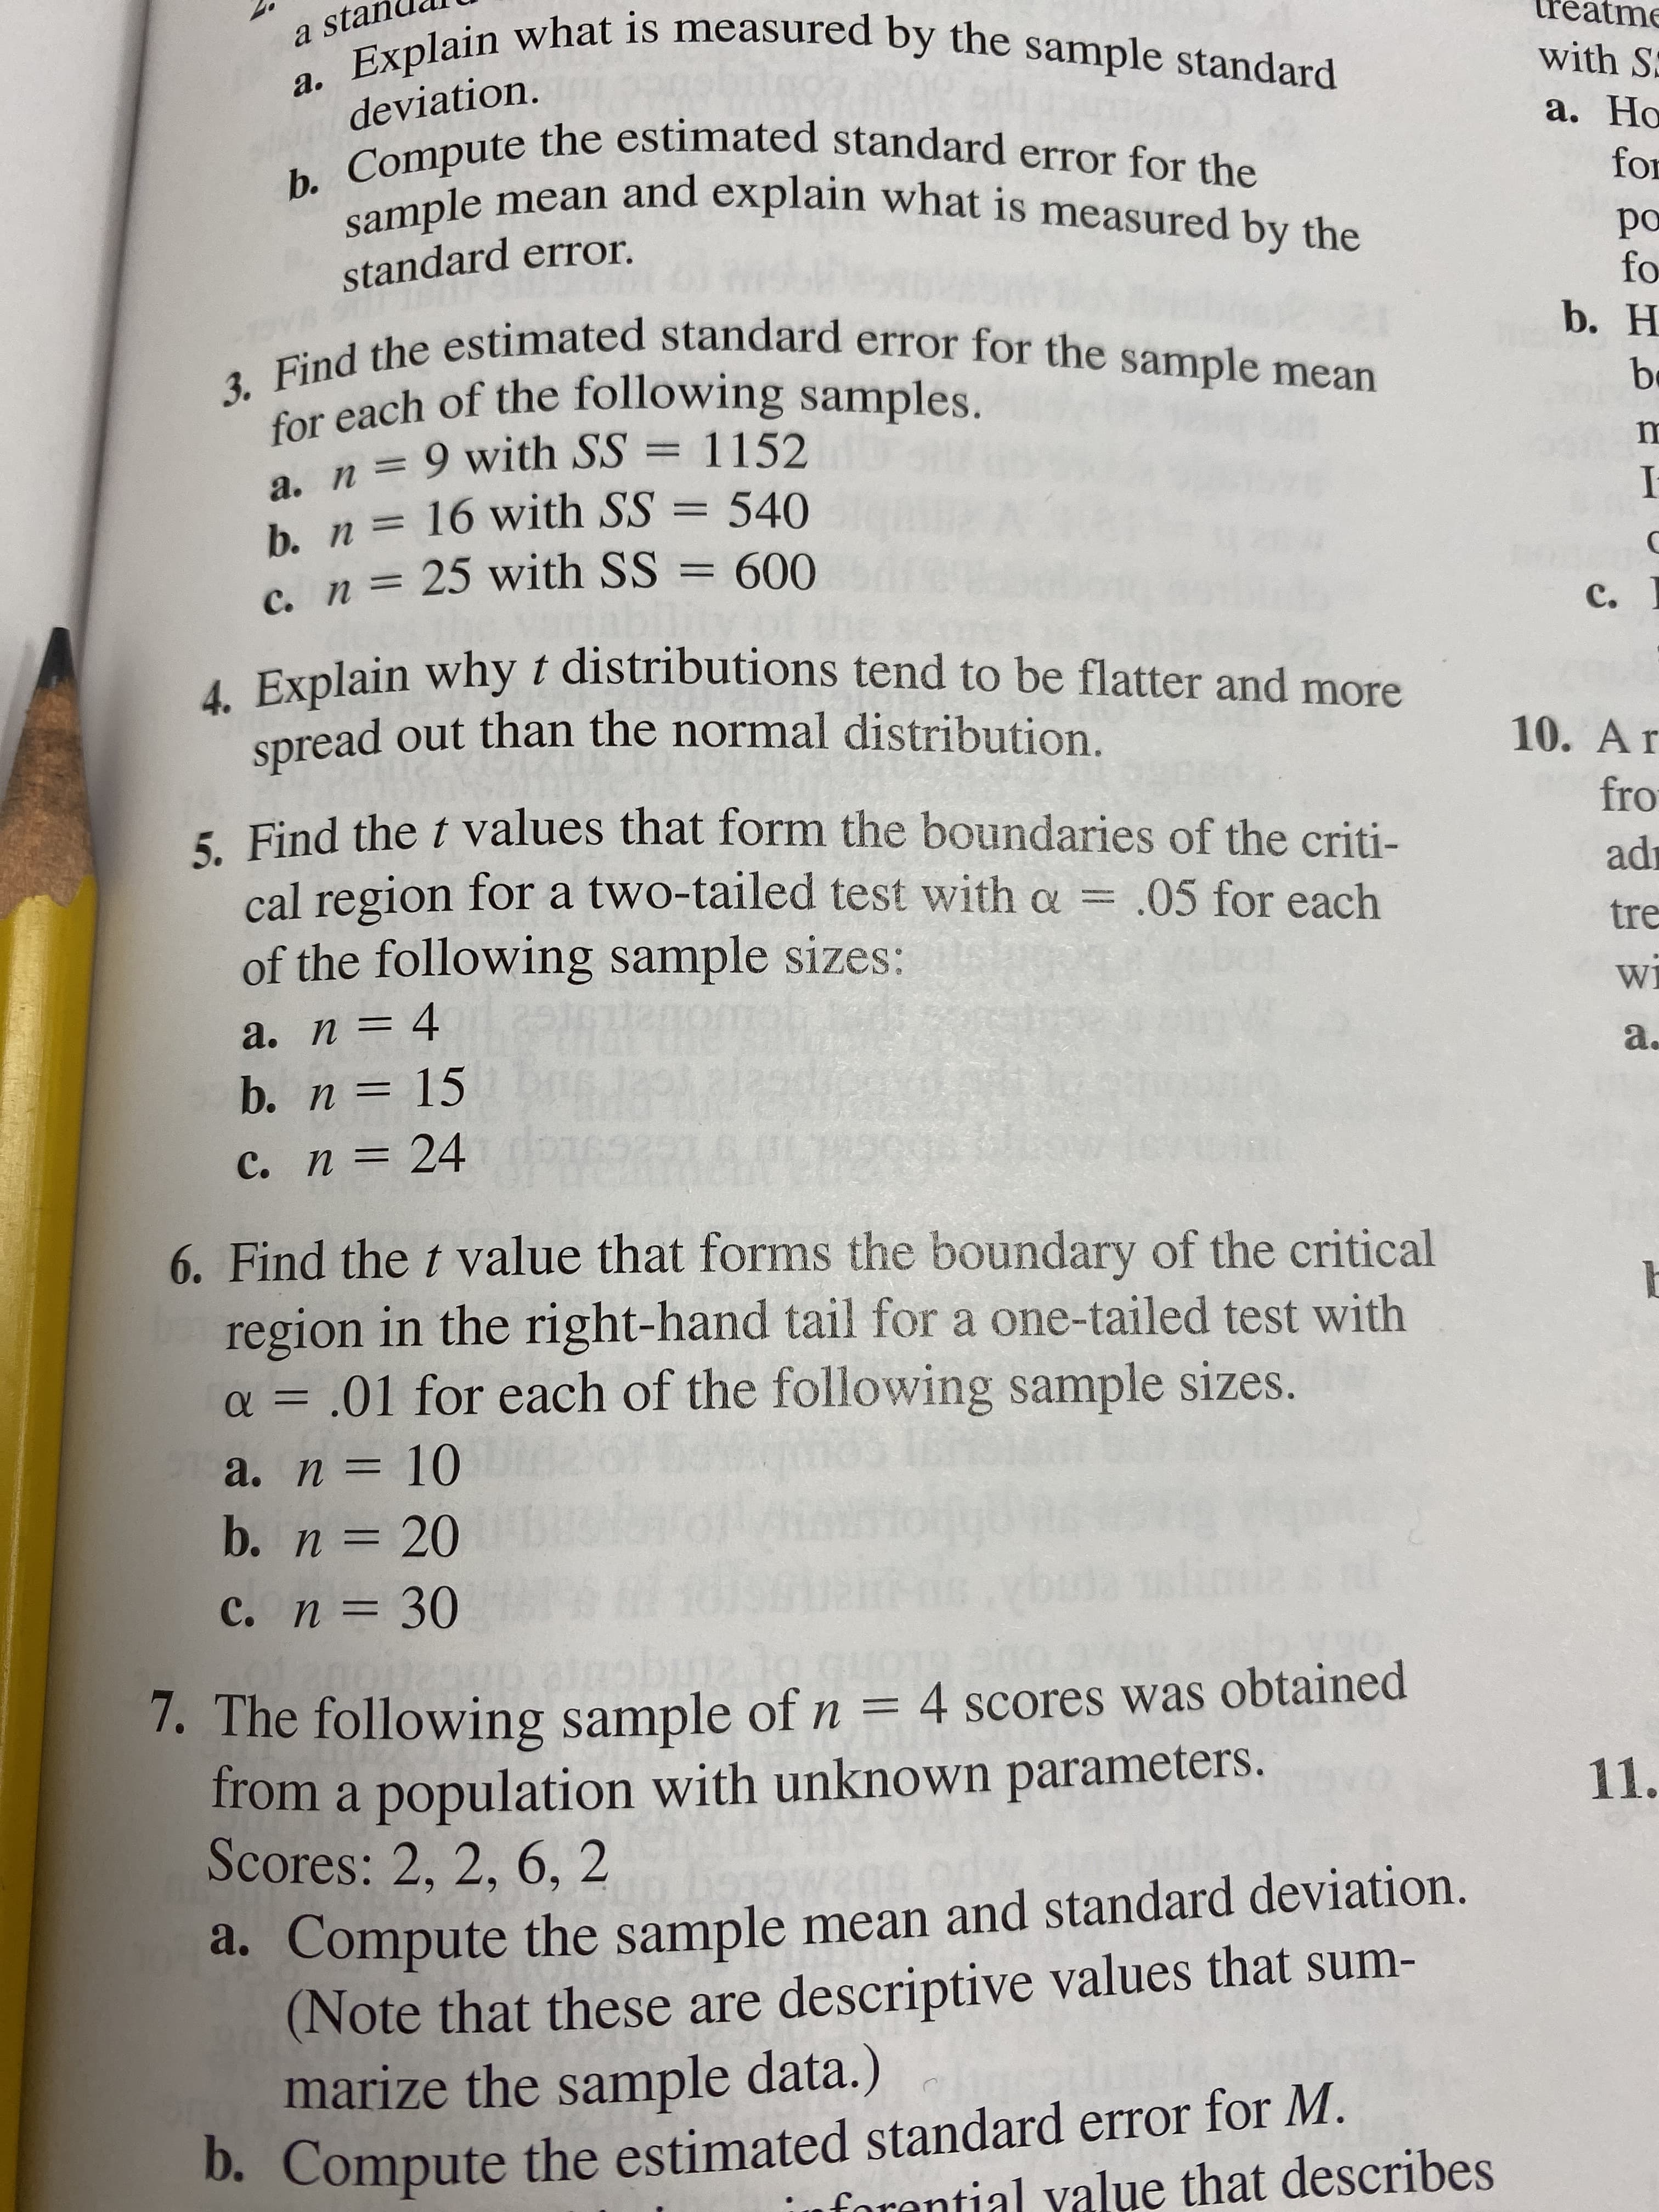
5 Find the t values that form the boundaries of the criti-
cal region for a two-tailed test with a = .05 for each
of the following sample sizes:
= 4 0R
b. n = 15 0
fro
ad
tre
Wi
а. п —
a.
DIC9R
с. п %3D 24
6. Find the t value that forms the boundary of the critical
region in the right-hand tail for a one-tailed test with
a = .01 for each of the following sample sizes.
TE
a. п 3D 10
b. n 20
c. n 30
1. The following sample of n = 4 scores was obtained
from a population with unknown parameters.
Scores: 2, 2, 6, 2
11.
a. Compute the sample mean and standard deviation.
(Note that these are descriptive values that sum-
marize the sample data.)
D. Compute the estimated standard error for M.
forantial value that describes
Expert Solution
This question has been solved!
Explore an expertly crafted, step-by-step solution for a thorough understanding of key concepts.

This is a popular solution!

Trending now
This is a popular solution!

Step by step
Solved in 3 steps with 3 images

Knowledge Booster


Learn more about
Need a deep-dive on the concept behind this application? Look no further. Learn more about this topic, statistics and related others by exploring similar questions and additional content below.Recommended textbooks for you
Glencoe Algebra 1, Student Edition, 9780079039897…
Algebra
ISBN:
9780079039897
Author:
Carter
Publisher:
McGraw Hill
Glencoe Algebra 1, Student Edition, 9780079039897…
Algebra
ISBN:
9780079039897
Author:
Carter
Publisher:
McGraw Hill