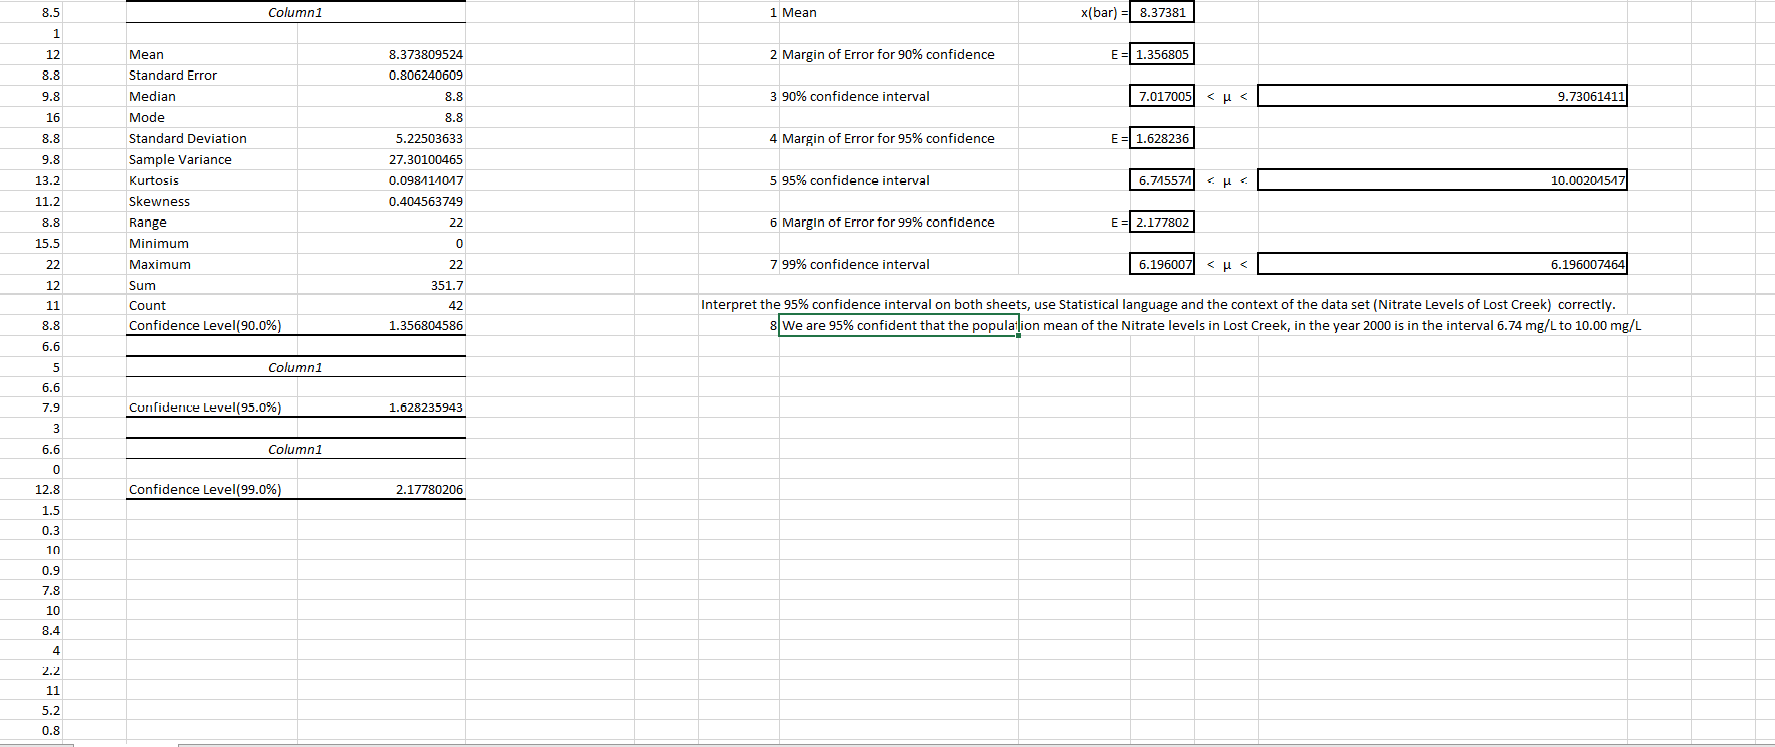
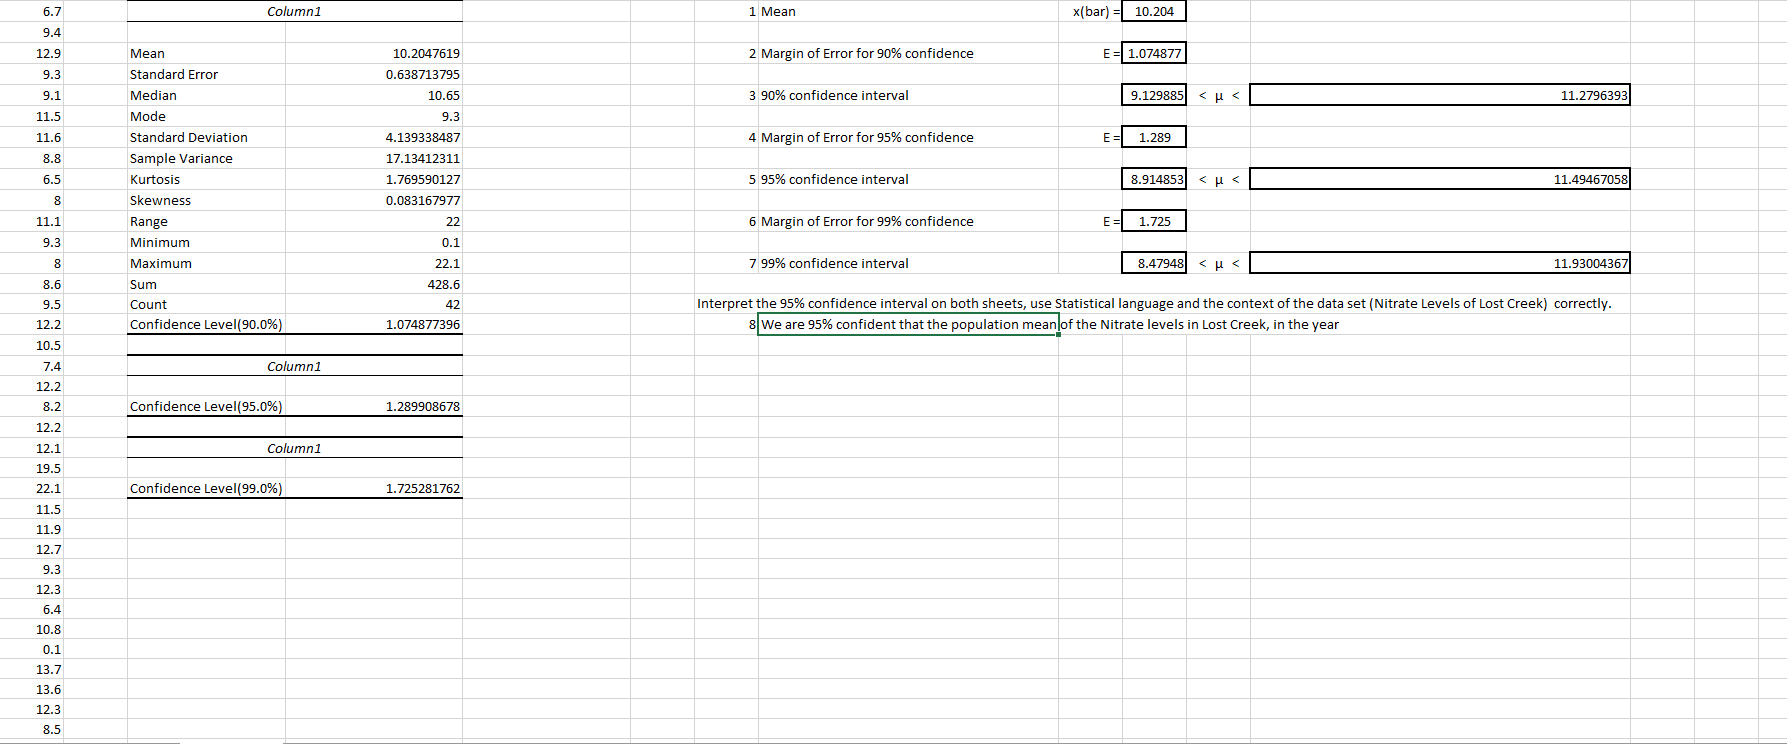
x(bar) 8.37381 8.5 Column1 1 Mean 1 E1.356805 12 Mean 8.373809524 2 Margin of Error for 90% confidence 8.8 Standard Error 0.806240609 3 90% confidence interval 7.017005 Median 8.8 9.8 < μ< 9.73061411 Mode 16 8.8 E1.628236 Standard Deviation 5.22503633 4 Margin of Error for 95% confidence 8.8 27.30100465 Sample Variance 9.8 5 95% confidence interval 10.00201517 13.2 Kurtosis 0.098111017 6.715571 <με 11.2 Skewness 0,404563749 Range 6 Margin of Error for 99% confidence E2.177802 8.8 22 15.5 Minimum 6.196007 7 99% confidence interval 6.196007464 22 22 Maximum 12 Sum 351.7 Interpret the 95% confidence interval on both sheets, use Statistical language and the context of the data set (Nitrate Levels of Lost Creek) correctly 8 We are 95% confident that the population mean of the Nitrate levels in Lost Creek, in the year 2000 is in the interval 6.74 mg/L to 10.00 mg/L 11 Count 42 Confidence Level(90.0%) 1.356804586 8.8 6.6 Column1 5 6.6 Cunfidence Level(95.0%) 7.9 1.628235943 Column1 6.6 0 Confidence Level(99.0%) 12.8 2.17780206 1.5 0.3 10 0.9 7.8 10 8.4 4 2.2 11 5.2 0.8 x(bar) 10.204 Column1 6.7 1 Mean 9.4 2 Margin of Error for 90% confidence E1.074877 12,9 Mean 10.2047619 Standard Error 9.3 0.638713795 9.129885 11.2796393 Median 10.65 3 90% confidence interval 9.1 Mode 11.5 9.3 Standard Deviation 4.139338487 E = 1.289 11.6 4 Margin of Error for 95% confidence 8.8 Sample Variance 17.13412311 8,914853 11,49467058 1,769590127 5 95% confidence interval 6.5 Kurtosis < μ< Skewness 8 0.083167977 Е - 11.1 Range 22 6 Margin of Error for 99% confidence 1.725 0.1 9.3 Minimum 11.93004367 7 99% confidence interval Maximum 22.1 8.47948 8.6 Sum 428.6 Interpret the 95% confidence interval on both sheets, use Statistical language and the context of the data set (Nitrate Levels of Lost Creek) correctly Count 9.5 42 8 We are 95% confident that the population mean of the Nitrate levels in Lost Creek, in the year Confidence Level(90.0%) 12.2 1.074877396 10.5 Column1 7.4 12.2 Confidence Level(95.0%) 8.2 1.289908678 12.2 Column1 12.1 19.5 Confidence Level(99.0%) 1,725281762 22.1 11.5 11.9 12.7 9.3 12.3 6.4 10.8 0.1 13.7 13.6 12,3 8.5


I need help with question 8. here is what I have said thus far, the instructions say, (8)"Be sure to use the correct parameter when interpreting (in this case the population mean). Also, the data set is measuring nitrate levels of Lost Creek and the units of measure are milligrams per liter (mg/L) so be sure you include that information in the interpretation. A thorough and complete statement about the data set and the interval we are confident the population mean (measured in mg/L) is within."
I have to answer the same question for both data sets. I know the data is correct, I am just worried my response is worded incorrectly. but I am still worried my response is incorrect any help would be appreciated.


Trending now
This is a popular solution!

Step by step
Solved in 2 steps


