Exponential Smoothing Forecasting Use the area below to draw a line chart for single exponential smoothing forecast. Smoothing constant 0.2 Time Observation Forecast Error Error^2 Formulas 5 Period 87 #N/A V#N/A I #N/A * #N/A V #N/A V #N/A V #N/A * #N/A * #N/A V #N/A * #N/A V #N/A 2 #N/A 93 88 89 #N/A 3 #N/A V #N/A 8. #N/A * #N/A * #N/A * #N/A 9 4 #N/A 10 97 #N/A 11 6. 86 #N/A 12 7 91 #N/A *#N/A * #N/A T #N/A #NIA v #NIA 8 89 92 13 #N/A 14 #N/A 93 89 94 15 10 #N/A 16 11 #N/A 17 12 #N/A 18 Next period forecast: 13 #N/A 19 20 MSE #N/A 21 22
Exponential Smoothing Forecasting Use the area below to draw a line chart for single exponential smoothing forecast. Smoothing constant 0.2 Time Observation Forecast Error Error^2 Formulas 5 Period 87 #N/A V#N/A I #N/A * #N/A V #N/A V #N/A V #N/A * #N/A * #N/A V #N/A * #N/A V #N/A 2 #N/A 93 88 89 #N/A 3 #N/A V #N/A 8. #N/A * #N/A * #N/A * #N/A 9 4 #N/A 10 97 #N/A 11 6. 86 #N/A 12 7 91 #N/A *#N/A * #N/A T #N/A #NIA v #NIA 8 89 92 13 #N/A 14 #N/A 93 89 94 15 10 #N/A 16 11 #N/A 17 12 #N/A 18 Next period forecast: 13 #N/A 19 20 MSE #N/A 21 22

Contemporary Marketing
18th Edition
ISBN:9780357033777
Author:Louis E. Boone, David L. Kurtz
Publisher:Louis E. Boone, David L. Kurtz
Chapter14: Pricing Strategies
Section14.2: Forecasting Demand
Problem 1LO

Related questions
Question
Could use a hand with this

Transcribed Image Text:D
F
H
I
J
L
N
R.
1 Exponential Smoothing Forecasting
Use the area below to draw a line chart for single exponential smoothing forecast.
3
Smoothing constant
0.2
4.
Time
Period
Observation Forecast Error
Error^2
Formulas
6.
1
87
#N/A
93
#N/A
V #N/A #N/A
7.
8
3
88
#N/A
#N/A
#N/A
4
89
#N/A
V #N/A
#N/A
9
V#N/A #N/A
* #N/A
I #N/A
V #N/A
V #N/A
F #N/A
* #N/A
* #N/A
10
97
#N/A
#N/A
* #N/A
* #N/A
* #N/A
* #N/A
* #N/A
* #N/A
11
6
86
#N/A
12
7
91
#N/A
13
8.
89
#N/A
14
9
92
#N/A
15
10
93
#N/A
16
11
89
#N/A
17
12
94
#N/A
18
Next period forecast:
13
#N/A
19
20
MSE
#N/A
21
22
23
24
25
26
27
28
29
30
31
32
33
34
35
36
37
38
39
40
A Sheeti
Give Feed
Calculation Mode: Automatic
Workbook Statistics
DII
80
F10
F5
F6
F7
F2
F3
F4
esc
&
%23
8
9
1
2
3
4
P
W
E
R
Y
|I
Transcribed Image Text:c/nb/ui/evo/index.html?elSBN=9780357131725&id=1357911454&snapshotld=2709085&
engage Lea X
Excel Online Student W X
C Excel Online Activity: M X
W Haas F1 Team - Wikipe X
ps Q Operations Manag..
Q
ENGAGE MINDTAP
ter 09 Excel Activity: Exponential Smoothing
Q Search this
n 1
I Video
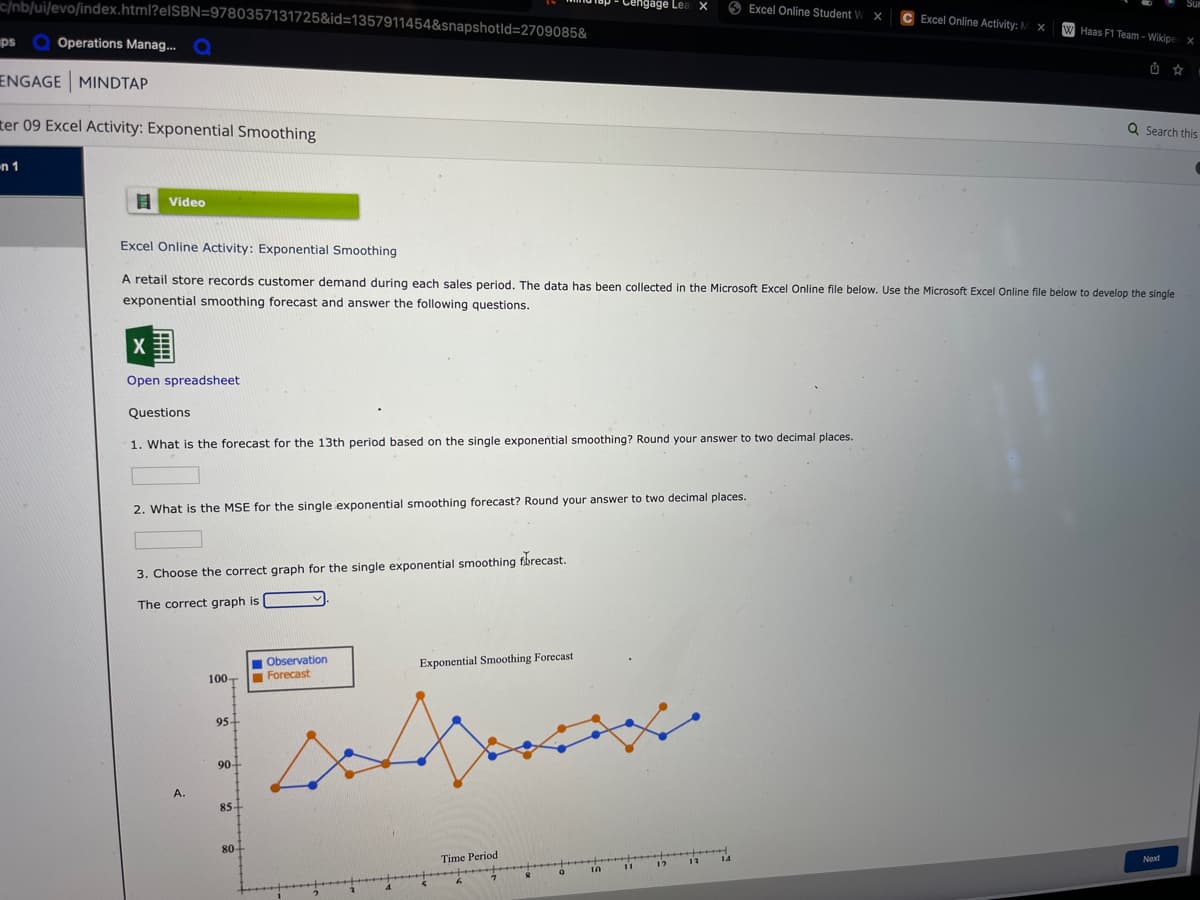
Excel Online Activity: Exponential Smoothing
A retail store records customer demand during each sales period. The data has been collected in the Microsoft Excel Online file below. Use the Microsoft Excel Online file below to develop the single
exponential smoothing forecast and answer the following questions.
Open spreadsheet
Questions
1. What is the forecast for the 13th period based on the single exponential smoothing? Round your answer to two decimal places.
2. What is the MSE for the single exponential smoothing forecast? Round your answer to two decimal places.
3. Choose the correct graph for the single exponential smoothing fbrecast.
The correct graph is
Observation
Forecast
Exponential Smoothing Forecast
100-
95+
90-
A.
85-
80+
Time Period
14
Next
12
Expert Solution
This question has been solved!
Explore an expertly crafted, step-by-step solution for a thorough understanding of key concepts.

Step by step
Solved in 2 steps with 4 images

Recommended textbooks for you
Contemporary Marketing
Marketing
ISBN:
9780357033777
Author:
Louis E. Boone, David L. Kurtz
Publisher:
Cengage Learning

Marketing
Marketing
ISBN:
9780357033791
Author:
Pride, William M
Publisher:
South Western Educational Publishing

Purchasing and Supply Chain Management
Operations Management
ISBN:
9781285869681
Author:
Robert M. Monczka, Robert B. Handfield, Larry C. Giunipero, James L. Patterson
Publisher:
Cengage Learning
Contemporary Marketing
Marketing
ISBN:
9780357033777
Author:
Louis E. Boone, David L. Kurtz
Publisher:
Cengage Learning
Marketing
Marketing
ISBN:
9780357033791
Author:
Pride, William M
Publisher:
South Western Educational Publishing
Purchasing and Supply Chain Management
Operations Management
ISBN:
9781285869681
Author:
Robert M. Monczka, Robert B. Handfield, Larry C. Giunipero, James L. Patterson
Publisher:
Cengage Learning