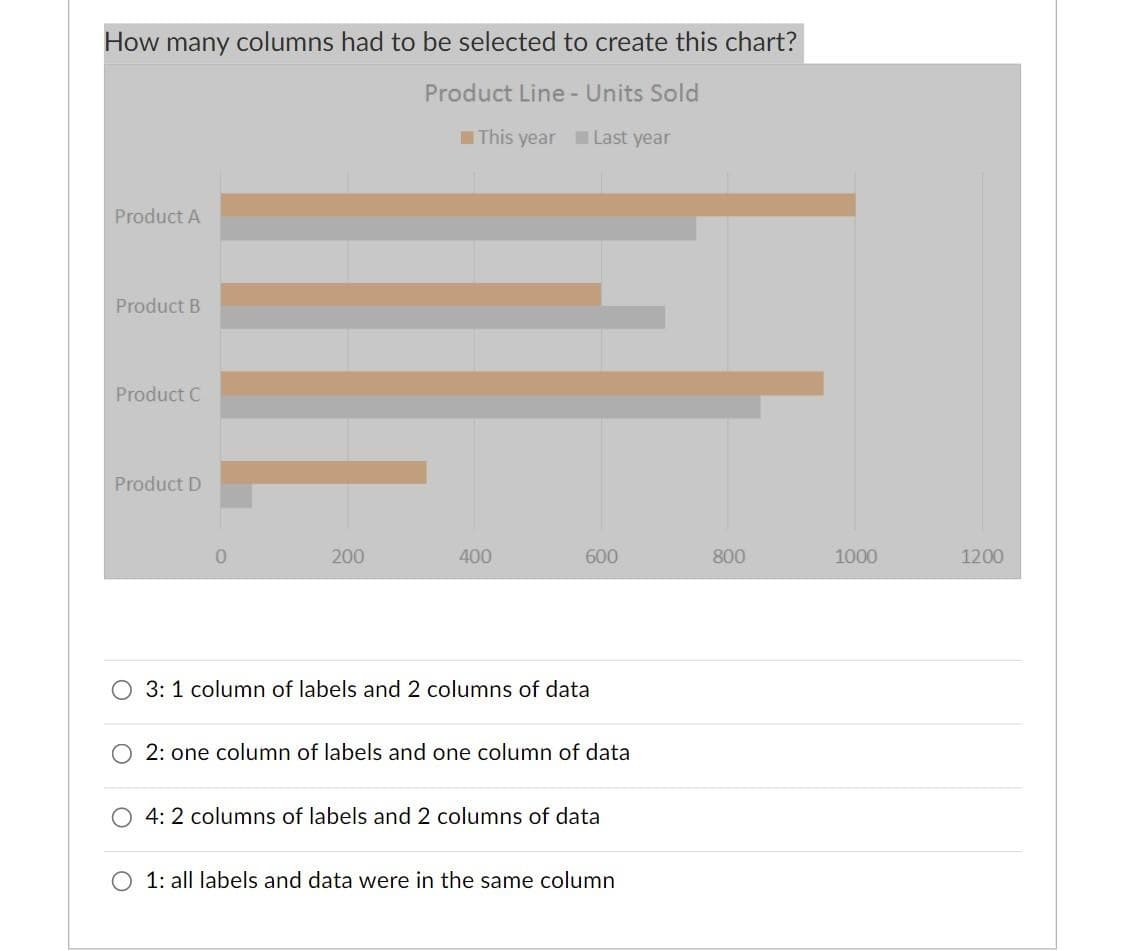
How many columns had to be selected to create this chart? Product Line - Units Sold This year Last year Product A Product B Product C Product D 200 400 600 800 1000 1200 3: 1 column of labels and 2 columns of data 2: one column of labels and one column of data 4: 2 columns of labels and 2 columns of data 1: all labels and data were in the same column


Q: for each medium with its audience coverage is given below. Television Newspaper Radio Cost per adver...
A: Here given decision variables -T = No. of Television adsN = No. of Newspaper adsR = No. of Radio ads
Q: xactly one of the four projects. The table below presents an estimate of the cost that each employee...
A: Assignment problems solve the problem of assigning different resources to different jobs available. ...
Q: I. Design a numerical example in order to demonstrate to the Productions and Operations Manager how ...
A: Break-even analysis is a method that is used by most manufacturing businesses. This method helps in ...
Q: Actual demand for a product for the past three months was Three months ago Two months ago 425 units ...
A:
Q: National Co. has developed a new production process to manufacture its product. The new process is c...
A: Given data is Learning curve = 70% Time taken by first unit = 100 hours
Q: a) Based on the given information, the best location for Marilyn Helm Retailers is to open the new r...
A: For deciding the best location for opening a retail outlet, the weighted score of each location has ...
Q: Data scientists are a necessary component to ensure an organization's business intelligence and anal...
A: Data scientists generally analyze the approach and model data then clarify or explain the outcomes t...
Q: Compare and contrast the focus on reducing the cost era with the focus on quality era within the ev...
A: Operations management is a wide field and has a long process chain from sourcing raw materials to de...
Q: Why is it important to view a batch-process operation as a network of interconnected queues?
A: Simply put, batch processing is the process of completing a set of tasks all at once. It's considere...
Q: In a multifactor-productivity measures, which measurement problem, with given the system in operatio...
A: a. Quality:- Quality of the product does not put any kind of effect on productivity. Quality is all ...
Q: All questions should be answered in the perspective of the vulnerable population!!!! Answers in smal...
A: Value creation happens when a business or association utilizes its work and assets to make something...
Q: Question 4 a. ABC Ltd. Wants to choose the best location for its new aluminum plant. The manager of ...
A: Break-even analysis is utilized to settle on choices that the number of units of items is to be deli...
Q: iEx transports products from their three processing plants directly to three warehouses. The product...
A: Given- Cost plan-
Q: Design a numerical example in order to demonstrate to the Productions and Operations Manager how bre...
A: Break-even analysis is a method that is used by most manufacturing businesses. This method helps in ...
Q: Everbright, a light bulb firm, faces both uncertain demand and supply, which can be modeled by norma...
A:
Q: Continue In another development in the firm’s evolving e-commerce strategy, Walmart has taken the ...
A: Walmart acquired Jet.com for $3.3 billion in 2016 to cope with Amazon's rapid growth. The organizati...
Q: Rock View Restaurant is a new fast food restaurant chain. The Operations Manager has divided its nor...
A: A line balancing is a method which helps to allocate the activities based on the consideration of di...
Q: a. A commercial project requires the installation of 1,856 square feet of acoustical ceiling. Using ...
A: Given- Area of acoustical Ceiling = 1,856 sq.ftProductivity Rate = 0.013 lhr / sq.ftProductivity Fac...
Q: 1. What is the garage's peak and effective capacities, in alignments per week? 2. During the second ...
A: A Small Introduction about Wheel Alignment A wheel alignment comprises of changing the points of ...
Q: Let us assume that a new medical facility, Health-care, is to be located in XYZ city. The location f...
A: The above table can be redrawn as, Sr Location factor Factor rating Location 1 Location 2 1 Fa...
Q: Howard Weiss, Inc., is considering building a sensitive new radiation scanning device. His managers ...
A: The expected return is indeed the profit or loss that an investor may expect from a given investment...
Q: under what circumstances do companies have the right to consider and ban legal employee behaviors du...
A: The hiring process can be stated as the approach of discovering, selecting, and recruiting new candi...
Q: Use the simplex method to maximize the given function. Assume all variables are nonnegative. Maximi...
A: In mathematics, a linear programming problem is a system for determining the maximum or lowest value...
Q: As part of a study for the Department of Labor Statistics, you are assigned the task of evaluating ...
A: The total efficiency with which labor and capital inputs are utilized jointly in the manufacturing p...
Q: PS.73 Golden Oldies is a small company that burns music CDs for non-technical senior citizens. The t...
A: Note: - As there are more than three subparts and we can answer only up to three subparts. Therefore...
Q: Engineers use math and science gained by study, experience, and practice to develop ways to economic...
A: A new emerging new innovation in structural engineering is influencing the construction industry mor...
Q: The utilization of machine 1 is about: A) 15% B) 19% 25% (D 55%
A: An utilization of the station indicating the proportion between total available time and actual prod...
Q: Consider the bill of material for product P and the data given in the following table. The master sc...
A: A master production plan helps to identify the required units of demand based on the parent material...
Q: Which of the following statements is / are not a strategic operations management decision. I. Determ...
A: In strategic Operations Management, the objective is to achieve profitability effectively and effici...
Q: Define chase strategy.
A: Inventory is the raw material, work-in-process material and finished products that are used for manu...
Q: Decide whether the following topics or research questions is qualitative or quantitative. Explain wh...
A: Culinary Arts Then And Now: Culinary arts are indeed the cuisine arts of preparing meals, dining, an...
Q: Duration Durations Figure 3. Project Schedule Network (Duration in Days) Q10-11-12 Consider the proj...
A:
Q: True or False? "Market researchers always prefer to use secondary data because secondary data is che...
A: Secondary data can be considered as the data which has been already collected and is available form ...
Q: In February 2017 the Team Project Manager and Flow Project Coordinator for Dell Technologies-Limeric...
A: The summary of the case brought to light important issues and elements. In order to finish the trans...
Q: The annual demand of Bulldogs Inc. sole product totaled 450,000 units. Due to uncertainty in supply ...
A: Given- Annual Demand = 450,000 unitsMax lead time = 2 weeks and 1 day = 14 days + 1 day = 15 daysSaf...
Q: What does one need to do to ensure that the project implementation is on track?
A: Project implementation can be defined as the process where the project is put into action so as to p...
Q: Page No. youvA Date Paoblem:1 2A companyis planning aonk foxce level feo Foue month.company has 20 w...
A: here, zero inventory is not possible since production per worker per day is in decimals. We cannot h...
Q: What is meant by the term productivity paradox and why the discussion on that topic has faded
A: The term "information technology" encompasses a wide range of disciplines and practises related to c...
Q: Discuss the three topics that should be summarized in the project management plan's work that needs ...
A: A goal, an aim, and a team make up a project management strategy. Any project needs a clear aim of w...
Q: In the case of any ERP system, what is the ideal testing strategy?
A: At its center, an ERP is an application that computerizes business processes, and gives insights and...
Q: Data series is not a function category in Excel O True O False
A: Microsoft excel functions the groups into 12 categories and they are, 1. Compatibility 2. Cube 3. Da...
Q: Amy Lloyd is interested in leasing a new car and has contacted three automobile dealers for pricing ...
A: Note: - Since we can answer only up to three subparts we will answer the first three subparts(a, b, ...
Q: explain how push and pull factors effect purchasing process
A: Push strategy: - In push strategy, the production and manufacturing of the products are conducted in...
Q: i. The efficiency rate of the training centre. ii. The utilisation rate of the centre. [
A: Design capacity = 1,800 employeesEffective capacity = 1,400 employeesActual output = 1,350 employees
Q: Littlefield Labs has three stations to process blood testing jobs. Fill out the following table on y...
A: The Bottleneck Rate of a directing is the rate (parts per unit time or assignments per unit season) ...
Q: The entries in the table denote the costs of assigning a task to a particular person. The plant supe...
A: Here, I would apply the Hungarian method to this assignment problem, we could see the cost element i...
Q: a. Use linear regression to find a relation to forecast Y, which is the quality parameter from the c...
A: The Equation of Linear Regression, The equation is Y= a + b*X, where Y is the dependent variable (th...
Q: How do you overcome these challenges, and what lessons do you lear
A: Accurate, on-time, and on-budget project completion is essential for success. In order to achieve ex...
Q: How would you classify the following job elements? Are they personal, fatigue, or delay?a) The opera...
A: A Small Introduction about Operation Management Activities the board is the organization of strat...
Q: Product differentiation relies on customers having different perceptions of the offered product or s...
A: Product differentiation refers to the strategy of a company in which it tries to achieve a competiti...


Trending now
This is a popular solution!

Step by step
Solved in 3 steps with 2 images

- Explain the term Forcasting. Why forcasting are Forecasting is one of the important functions of management. It is a part and parcel of planning function. Forecasting means prediction about future. Forecasting means analysis of future about the operations of an enterprise. It involves looking ahead for future event. Forecasting means a process of providing the details supported by budget. Forecasting means drawing a conclusion about production, sales, profit on the basis of research, study & survey.Demand forecasting helps a company to respond quickly to market changesgiving the firm a competitive advantage. The process of forecasting establishesthe link between planning and control for the company, and facilitates theeffective output of the firm’s goods and services. A common quantitativemethod of forecasting is time series. Explain what is involved in time seriesanalysis and its significance to demand forecasting.******PLS NEW ANS******* What are some factors when preparing a sales forecast that would lead you to rely on one or two of these techniques more than the others? Support your choice with evidence. Four techniques used for forecasting sales (market researchers, delphi technique, trend analysis, and econometric models)
- 26- Which among the following is the correct feature for staple merchandise categories? a. Short selling of goods b. Involves continuous replenishment c. Forecasting is challenging d. Demand for a short period of timewhich of the following statements is not true? a. the purpose of forecasting is to generate good forecasting on average over time, b. Forecasting for a shorter time period are usually more accurate than forecasting for a longer time horizon. c. it is difficult to forecast accurately; indeed, it is impossible. d. forecasting for groups of items are often less accurate than forecasting demand for single itemsThe following table shows the past two years of quarterly sales information. Assume that there are both trend and seasonal factors and that the seasonal cycle is one year. Use time series decomposition to forecast quarterly sales for the next year. (Do not round intermediate calculations. Round your answers to the nearest whole number.) Note:- Do not provide handwritten solution. Maintain accuracy and quality in your answer. Take care of plagiarism. Answer completely. You will get up vote for sure.
- As a small business owner, Emil understands the importance of sales forecasting to entrepreneurial success. Which of the following is correct regarding a sales forecast? Organizations rely on correlation analyses as their exclusive sales forecasting method. It is an estimate of the amount of a product that an organization expects to sell during a certain period of time. The accuracy of a sales forecast is not important. It is based on an unspecified level of marketing effort. 41. The table below shows the sales figure for a brand of shoe over the last 12 months. MONTHS SALES January 69 February 75 March 86 April 92 May 95 June 100 July 108 August 115 September 125 October 131 November 140 December 150 Using the following, forecast the sales for the months up to January the following year:- 1. A simple three month moving average.ii. A three period weighted moving average using weights of 1, 2 and 3. Assign the highest weight to the most recent data.iii. Exponential Smoothing when a= .6 and the forecast for March is 350.Which of the following methods lends itself to forecasts for long-term emerging phenomena or revolutionary technologies? A. the sales force estimate technique B. the delphi method C. the jury of executive opinion method D. market testing
- A cosmetic manufacturer wants to understand why users shop online versus in store, and how they might take better advantage of the online channel; the manufacturer wants to make improvements to the company’s website. The manufacturer also wants to find out why Nordstrom.com (a competitor’s website) appeals to cosmetic consumers versus other websites. The cosmetic manufacturer also wants to find ways to improve consumers’ in-store experience. Further, the manufacturer want to produce a three (3) month sales forecast based on the data produced from the research. Write a report about the marketing research process and your findings. Your report should include: Describe the research design. Use the qualitative method: Netnography. For each give the following details: Participants i. Numbers, gender, age, how selected. Justify each Interviews i. How many, the setting & process, length of time. Justify each ii. Questions/discussions held related to the 4 objectives Ethical…ABC Inc. sells patio sets. Monthly sales for a seven-month period were as follows: Month Sales (000) Unites Feb 19 Mar 18 Apr 15 May 20 Jun 18 Jul 22 Aug 20 Forecast September sales volume using a weighted average approach using 0.60 for August, 0.30 for July, and 0.10 for June.Distinguish between the following types of forecasts:a. Aggregate versus single item.b. Short-term versus long-term.c. Causal versus naive.