Express the indicated degree of likelihood as a probability value between 0 and 1 inclusive. Based on a report in a magazine, 26.6% of survey respondents have sleepwalked. The probability is (Simplify your answer. Round to three decimal places as needed.)
Express the indicated degree of likelihood as a probability value between 0 and 1 inclusive. Based on a report in a magazine, 26.6% of survey respondents have sleepwalked. The probability is (Simplify your answer. Round to three decimal places as needed.)
Chapter9: Sequences, Probability And Counting Theory
Section9.7: Probability
Problem 1SE: What term is used to express the likelihood of an event occurring? Are there restrictions on its...
Related questions
Question
Solve both plzz

Transcribed Image Text:Express the indicated degree of likelihood as a probability value between 0 and 1 inclusive.
Based on a report in a magazine, 26.6% of survey respondents have sleepwalked.
The probability is
(Simplify your answer. Round to three decimal places as needed.)

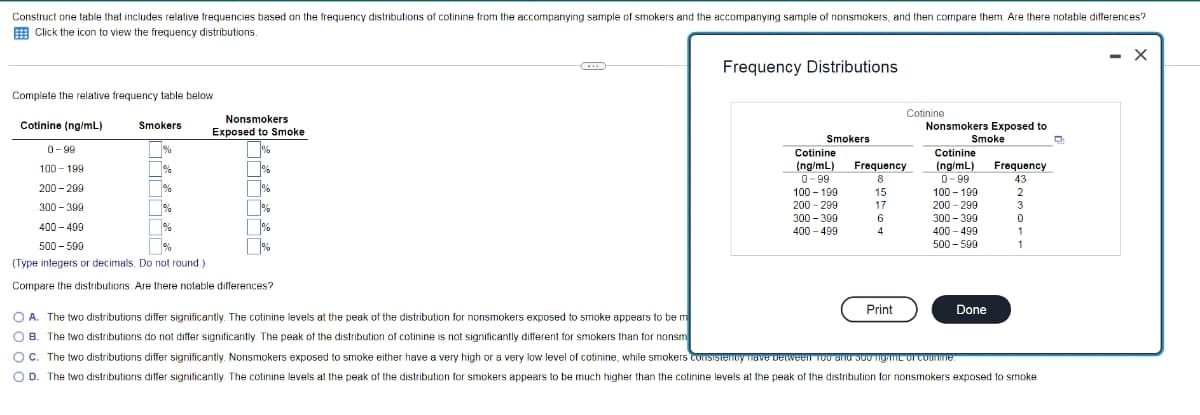
Transcribed Image Text:Construct one table that includes relative frequencies based on the frequency distributions of cotinine from the accompanying sample of smokers and the accompanying sample of nonsmokers, and then compare them. Are there notable differences?
E Click the icon to view the frequency distributions.
- X
Frequency Distributions
Complete the relative frequency table below
Cotinine
Nonsmokers
Cotinine (ng/mL)
Smokers
Nonsmokers Exposed to
Exposed to Smoke
Smokers
Smoke
0- 99
Cotinine
Cotinine
(ng/mL)
0- 99
Frequency
(ng/mL)
0- 99
100 - 199
200 - 299
300 - 399
400 - 499
100 - 199
%
Frequency
8
43
200 - 299
%
100 - 199
15
2
200 - 299
300 - 399
%
T%
%
300 - 399
17
3
6
400 - 499
400 - 499
4
1
500 - 599
%
500 - 599
1
(Type integers or decimals. Do not round.)
Compare the distributions. Are there notable differences?
Print
Done
O A. The two distributions differ significantly. The cotinine levels at the peak of the distribution for nonsmokers exposed to smoke appears to be m
O B. The two distributions do not differ significantly The peak of the distribution of cotinine is not significantly different for smokers than for nonsm
O C. The two distributions differ significantly. Nonsmokers exposed to smoke either have a very high or a very low level of cotinine, while smokers cOISISTenuy nave veLween Tou anu J00 TigTL OT Coune.
O D. The two distributions differ significantly. The cotinine levels at the peak of the distribution for smokers appears to be much higher than the cotinine levels at the peak of the distribution for nonsmokers exposed to smoke
Expert Solution
This question has been solved!
Explore an expertly crafted, step-by-step solution for a thorough understanding of key concepts.
This is a popular solution!
Trending now
This is a popular solution!
Step by step
Solved in 3 steps with 3 images

Recommended textbooks for you

