(f) Which time of day and advertisement position maximizes consumer response? Compute a 95 percent (individual) confidence interval for the mean number of calls placed for this time of day/ad position combination.
(f) Which time of day and advertisement position maximizes consumer response? Compute a 95 percent (individual) confidence interval for the mean number of calls placed for this time of day/ad position combination.

Holt Mcdougal Larson Pre-algebra: Student Edition 2012
1st Edition
ISBN:9780547587776
Author:HOLT MCDOUGAL
Publisher:HOLT MCDOUGAL
Chapter11: Data Analysis And Probability
Section: Chapter Questions
Problem 8CR

Related questions
Question
Please help me answers the questions here. Thx
Transcribed Image Text:(f) Which time of day and advertisement position maximizes consumer response? Compute a 95
percent (individual) confidence interval for the mean number of calls placed for this time of
daylad position combination.
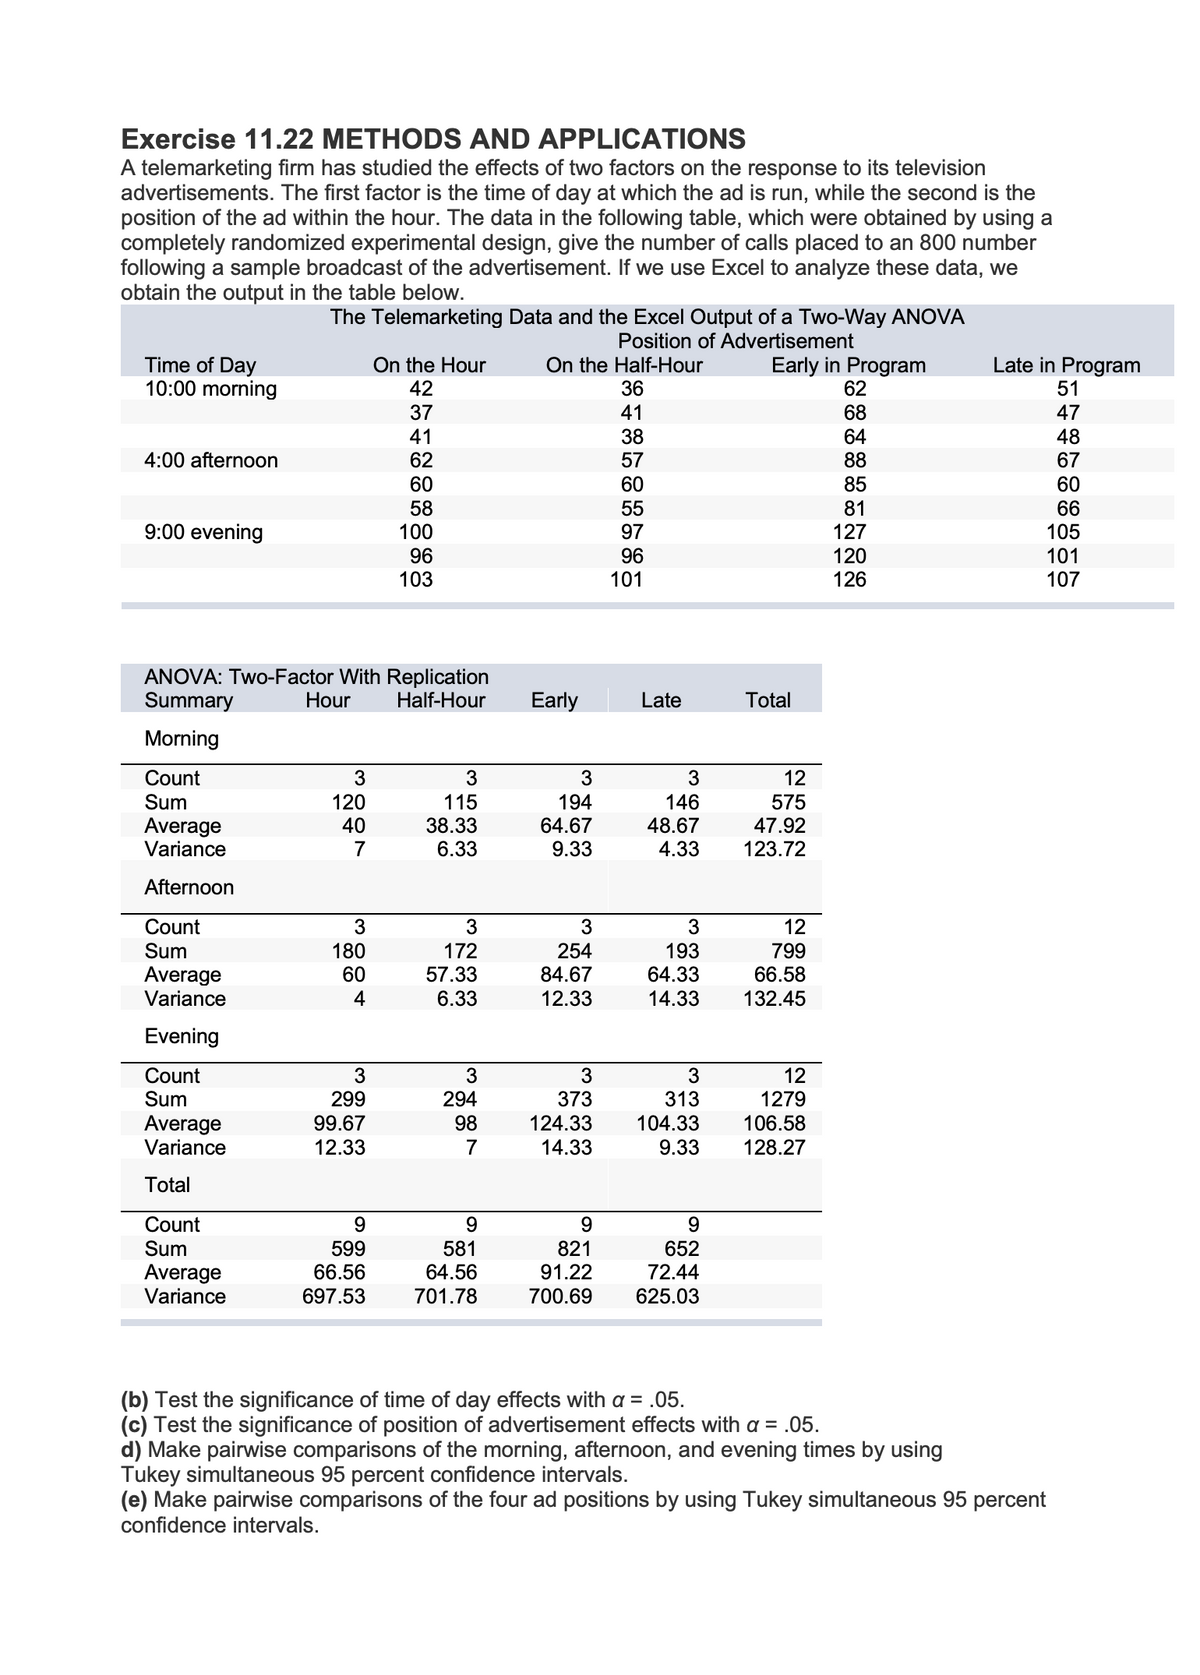
Transcribed Image Text:Exercise 11.22 METHODS AND APPLICATIONS
A telemarketing firm has studied the effects of two factors on the response to its television
advertisements. The first factor is the time of day at which the ad is run, while the second is the
position of the ad within the hour. The data in the following table, which were obtained by using a
completely randomized experimental design, give the number of calls placed to an 800 number
following a sample broadcast of the advertisement. If we use Excel to analyze these data, we
obtain the output in the table below.
The Telemarketing Data and the Excel Output of a Two-Way ANOVA
Position of Advertisement
Time of Day
10:00 morning
On the Hour
42
On the Half-Hour
36
Early in Program
62
Late in Program
51
37
41
68
47
41
62
38
64
88
48
67
4:00 afternoon
57
60
58
100
96
103
60
85
60
66
105
101
107
81
127
55
9:00 evening
97
120
126
96
101
ANOVA: Two-Factor With Replication
Hour
Summary
Half-Hour
Early
Late
Total
Morning
Count
3
12
194
64.67
9.33
Sum
120
40
115
38.33
6.33
146
48.67
4.33
575
Average
Variance
47.92
123.72
7
Afternoon
Count
3
3
3
12
Sum
172
180
60
254
193
64.33
799
66.58
Average
Variance
84.67
12.33
57.33
4
6.33
14.33
132.45
Evening
Count
Sum
3
373
3
313
12
1279
299
294
Average
Variance
99.67
98
124.33
104.33
106.58
12.33
7
14.33
9.33
128.27
Total
Count
9.
9.
9.
9.
821
599
66.56
581
64.56
652
72.44
625.03
Sum
Average
Variance
91.22
697.53
701.78
700.69
(b) Test the significance of time of day effects with a = .05.
(c) Test the significance of position of advertisement effects with a = .05.
d) Make pairwise comparisons of the morning, afternoon, and evening times by using
Tukey simultaneous 95 percent confidence intervals.
(e) Make pairwise comparisons of the four ad positions by using Tukey simultaneous 95 percent
confidence intervals.
Expert Solution
This question has been solved!
Explore an expertly crafted, step-by-step solution for a thorough understanding of key concepts.

This is a popular solution!

Trending now
This is a popular solution!

Step by step
Solved in 4 steps with 1 images

Recommended textbooks for you
Holt Mcdougal Larson Pre-algebra: Student Edition…
Algebra
ISBN:
9780547587776
Author:
HOLT MCDOUGAL
Publisher:
HOLT MCDOUGAL
Holt Mcdougal Larson Pre-algebra: Student Edition…
Algebra
ISBN:
9780547587776
Author:
HOLT MCDOUGAL
Publisher:
HOLT MCDOUGAL