Which of the following is a correct interpretation of the confidence interval for the die height coefficient?
Which of the following is a correct interpretation of the confidence interval for the die height coefficient?

Chapter3: Polynomial Functions
Section3.5: Mathematical Modeling And Variation
Problem 2ECP

Related questions

Question
100%
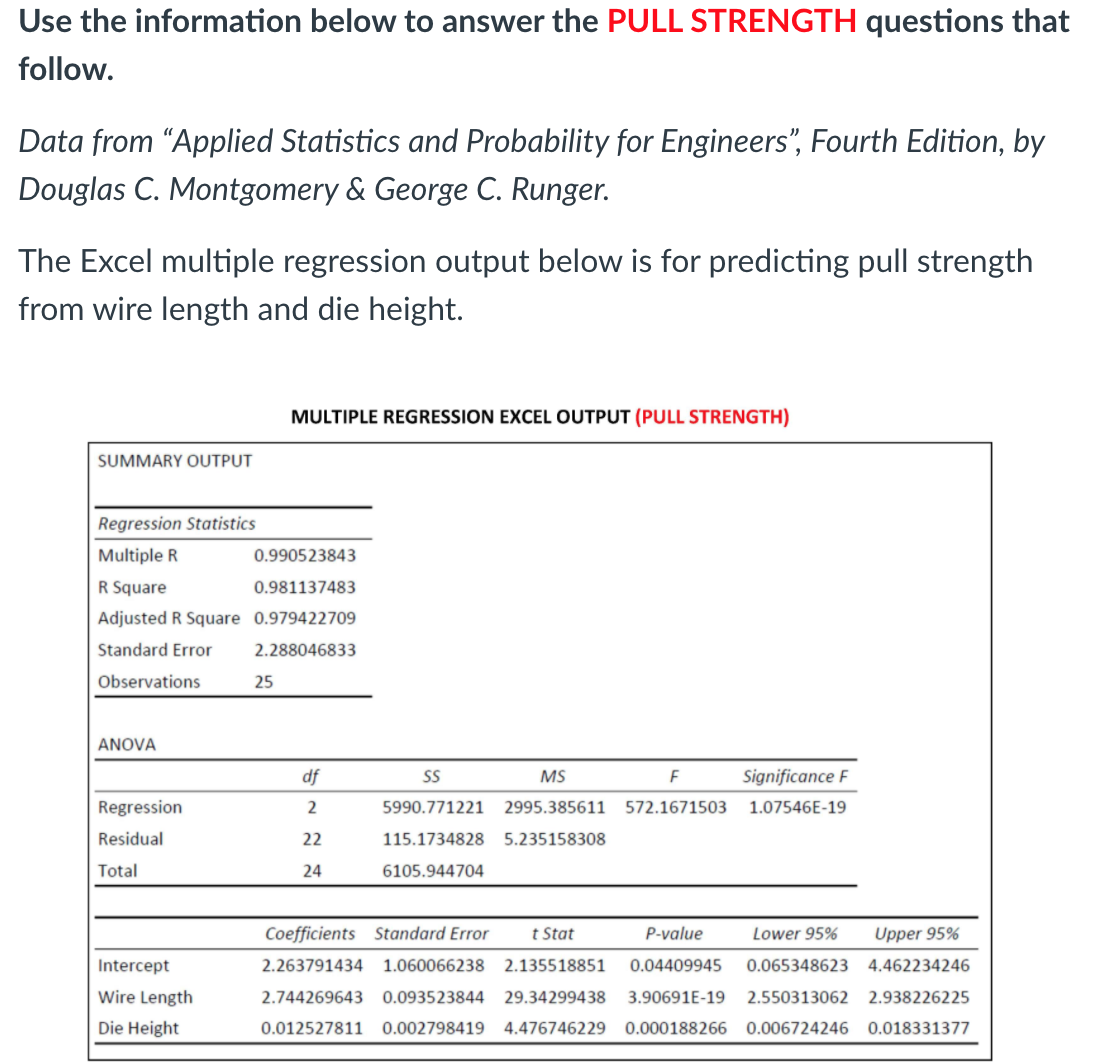
Transcribed Image Text:Use the information below to answer the PULL STRENGTH questions that
follow.
Data from "Applied Statistics and Probability for Engineers", Fourth Edition, by
Douglas C. Montgomery & George C. Runger.
The Excel multiple regression output below is for predicting pull strength
from wire length and die height.
MULTIPLE REGRESSION EXCEL OUTPUT (PULL STRENGTH)
SUMMARY OUTPUT
Regression Statistics
Multiple R
0.990523843
R Square
0.981137483
Adjusted R Square 0.979422709
Standard Error
2.288046833
Observations
25
ANOVA
df
S
MS
Significance F
Regression
5990.771221
2995.385611 572.1671503
1.07546E-19
Residual
22
115.1734828 5.235158308
Total
24
6105.944704
Coefficients Standard Error
t Stat
P-value
Lower 95%
Upper 95%
Intercept
2.263791434 1.060066238 2.135518851
0.04409945
0.065348623
4.462234246
Wire Length
2.744269643 0.093523844 29.34299438
3.90691E-19
2.550313062
2.938226225
Die Height
0.012527811 0.002798419 4.476746229 0.000188266
0.006724246 0.018331377
Transcribed Image Text:PULL STRENGTH
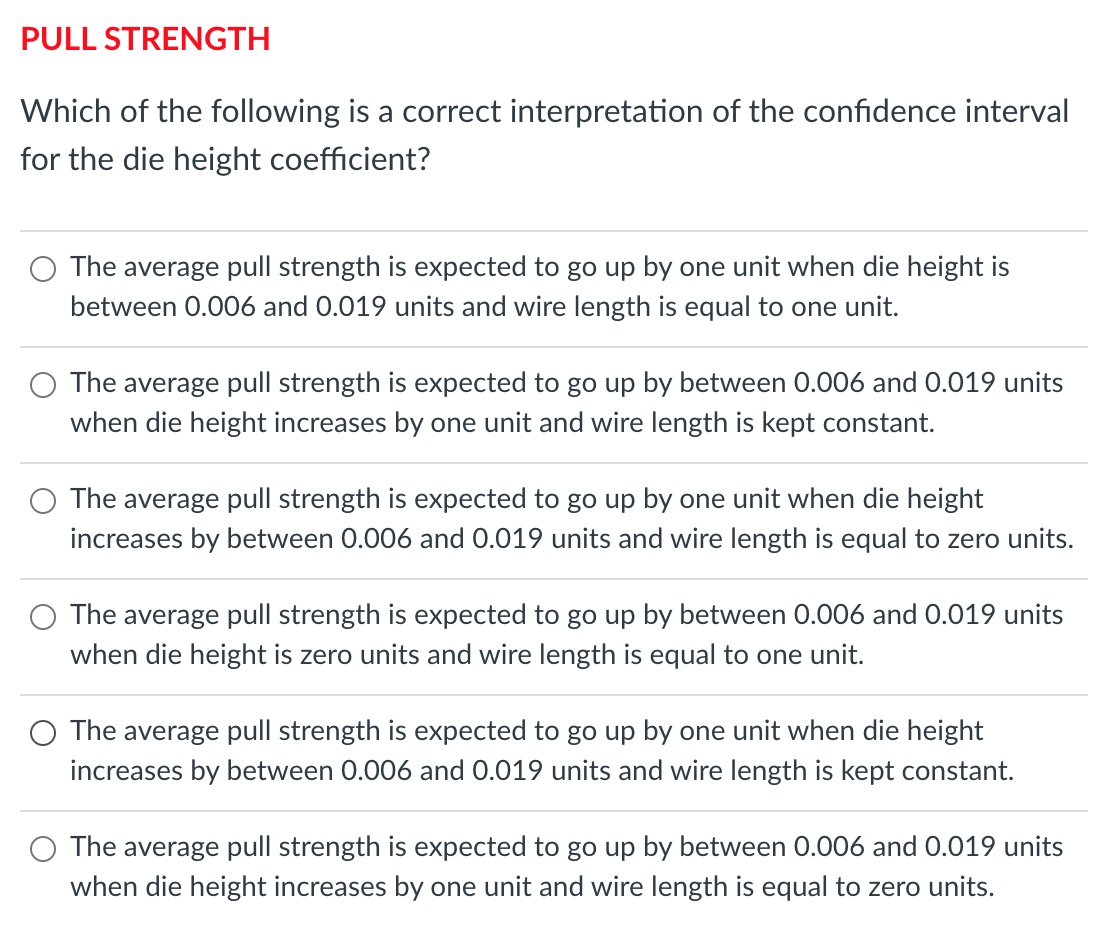
Which of the following is a correct interpretation of the confidence interval
for the die height coefficient?
The average pull strength is expected to go up by one unit when die height is
between 0.006 and 0.019 units and wire length is equal to one unit.
The average pull strength is expected to go up by between 0.006 and 0.019 units
when die height increases by one unit and wire length is kept constant.
The average pull strength is expected to go up by one unit when die height
increases by between 0.006 and 0.019 units and wire length is equal to zero units.
The average pull strength is expected to go up by between 0.006 and 0.019 units
when die height is zero units and wire length is equal to one unit.
The average pull strength is expected to go up by one unit when die height
increases by between 0.006 and 0.019 units and wire length is kept constant.
O The average pull strength is expected to go up by between 0.006 and 0.019 units
when die height increases by one unit and wire length is equal to zero units.
Expert Solution
This question has been solved!
Explore an expertly crafted, step-by-step solution for a thorough understanding of key concepts.

This is a popular solution!

Trending now
This is a popular solution!

Step by step
Solved in 2 steps with 1 images

Knowledge Booster


Learn more about
Need a deep-dive on the concept behind this application? Look no further. Learn more about this topic, statistics and related others by exploring similar questions and additional content below.Recommended textbooks for you

Algebra & Trigonometry with Analytic Geometry
Algebra
ISBN:
9781133382119
Author:
Swokowski
Publisher:
Cengage

Glencoe Algebra 1, Student Edition, 9780079039897…
Algebra
ISBN:
9780079039897
Author:
Carter
Publisher:
McGraw Hill
Algebra & Trigonometry with Analytic Geometry
Algebra
ISBN:
9781133382119
Author:
Swokowski
Publisher:
Cengage
Glencoe Algebra 1, Student Edition, 9780079039897…
Algebra
ISBN:
9780079039897
Author:
Carter
Publisher:
McGraw Hill

Functions and Change: A Modeling Approach to Coll…
Algebra
ISBN:
9781337111348
Author:
Bruce Crauder, Benny Evans, Alan Noell
Publisher:
Cengage Learning

Big Ideas Math A Bridge To Success Algebra 1: Stu…
Algebra
ISBN:
9781680331141
Author:
HOUGHTON MIFFLIN HARCOURT
Publisher:
Houghton Mifflin Harcourt