The demand and supply functions for two related commodities A and B in two different markets are defined below: Qda= 410-5PA-2P. Qdn= 295-PA-3P. QSA= -60+3PA Qsn= -120+2P, I. Find the equilibrium conditions in the two markets li. How are goods A and B related? Explain your answer.
The demand and supply functions for two related commodities A and B in two different markets are defined below: Qda= 410-5PA-2P. Qdn= 295-PA-3P. QSA= -60+3PA Qsn= -120+2P, I. Find the equilibrium conditions in the two markets li. How are goods A and B related? Explain your answer.

Managerial Economics: A Problem Solving Approach
5th Edition
ISBN:9781337106665
Author:Luke M. Froeb, Brian T. McCann, Michael R. Ward, Mike Shor
Publisher:Luke M. Froeb, Brian T. McCann, Michael R. Ward, Mike Shor
Chapter6: Simple Pricing
Section: Chapter Questions
Problem 7MC

Related questions
Question
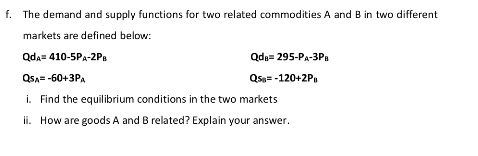
Transcribed Image Text:f. The demand and supply functions for two related commodities A and B in two different
markets are defined below:
Qda= 410-5PA-2PB
Qda= 295-PA-3P.
QsA= -60+3PA
Qss= -120+2P
i. Find the equilibrium conditions in the two markets
ii. How are goods A and B related? Explain your answer.
Expert Solution
This question has been solved!
Explore an expertly crafted, step-by-step solution for a thorough understanding of key concepts.

This is a popular solution!

Trending now
This is a popular solution!

Step by step
Solved in 2 steps

Knowledge Booster


Learn more about
Need a deep-dive on the concept behind this application? Look no further. Learn more about this topic, economics and related others by exploring similar questions and additional content below.Recommended textbooks for you
Managerial Economics: A Problem Solving Approach
Economics
ISBN:
9781337106665
Author:
Luke M. Froeb, Brian T. McCann, Michael R. Ward, Mike Shor
Publisher:
Cengage Learning

Managerial Economics: Applications, Strategies an…
Economics
ISBN:
9781305506381
Author:
James R. McGuigan, R. Charles Moyer, Frederick H.deB. Harris
Publisher:
Cengage Learning
Managerial Economics: A Problem Solving Approach
Economics
ISBN:
9781337106665
Author:
Luke M. Froeb, Brian T. McCann, Michael R. Ward, Mike Shor
Publisher:
Cengage Learning
Managerial Economics: Applications, Strategies an…
Economics
ISBN:
9781305506381
Author:
James R. McGuigan, R. Charles Moyer, Frederick H.deB. Harris
Publisher:
Cengage Learning