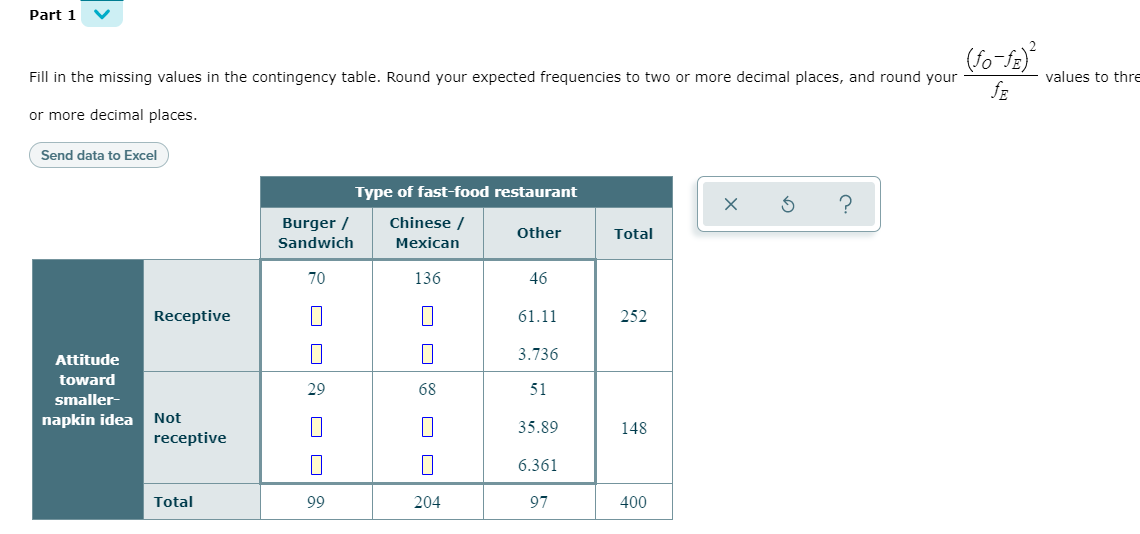
Fast-food restaurants are always looking for ways to cut down on expenses. Believe it or not, such restaurants may be able to decrease yearly expenses simply by decreasing the size of the paper napkins they provide to patrons. (Such a change also puts the restaurants in a more environmentally friendly position.) Papel Paper Products, a major paper company hoping to infiltrate the restaurant supply market, is considering pitching the smaller-napkin idea to potential restaurant clients. To determine the receptiveness of different restaurants to the idea, Papel surveyed 400 fast-food establishments chosen at random, and looked at the data according to two variables: type of fast-food restaurant ("burger/sandwich", "Chinese/Mexican", or "other") and attitude toward the smaller-napkin idea ("receptive" or "not receptive.") The data are summarized in the contingency table below. Each of the 6 cells of the table contains three numbers: the first number is the observed cell frequency (fO); the second number is the expected cell frequency (fE) under the assumption that the two variables type of fast-food restaurant and attitude toward the smaller-napkin idea are not associated; and the third number is the following value. =−fOfE2fE−Observed cell frequencyExpected cell frequency2Expected cell frequency Answer the following to summarize the test of the hypothesis that the two variables type of fast-food restaurant and attitude toward the smaller-napkin idea are not associated. For your test, use the 0.10 level of significance. (a)Determine the type of test statistic to use. Type of test statistic: ▼(Choose one) (b)Find the value of the test statistic. (Round to two or more decimal places.) (c)Find the p-value. (Round to three or more decimal places.)


Contingency Table
A contingency table can be defined as the visual representation of the relationship between two or more categorical variables that can be evaluated and registered. It is a categorical version of the scatterplot, which is used to investigate the linear relationship between two variables. A contingency table is indeed a type of frequency distribution table that displays two variables at the same time.
Binomial Distribution
Binomial is an algebraic expression of the sum or the difference of two terms. Before knowing about binomial distribution, we must know about the binomial theorem.
Fast-food restaurants are always looking for ways to cut down on expenses. Believe it or not, such restaurants may be able to decrease yearly expenses simply by decreasing the size of the paper napkins they provide to patrons. (Such a change also puts the restaurants in a more environmentally friendly position.) Papel Paper Products, a major paper company hoping to infiltrate the restaurant supply market, is considering pitching the smaller-napkin idea to potential restaurant clients.
To determine the receptiveness of different restaurants to the idea, Papel surveyed 400 fast-food establishments chosen at random, and looked at the data according to two variables: type of fast-food restaurant ("burger/sandwich", "Chinese/Mexican", or "other") and attitude toward the smaller-napkin idea ("receptive" or "not receptive.")
The data are summarized in the
Answer the following to summarize the test of the hypothesis that the two variables type of fast-food restaurant and attitude toward the smaller-napkin idea are not associated. For your test, use the
|


Trending now
This is a popular solution!

Step by step
Solved in 5 steps


