Female Male 161.8 18-29 161.2 170.2 162.9 155.5 168.0 153.3 152.0 154.9 172.8 178.7 183.1 175.9 177.5 170.5 180.1 178.6 178.5 165.4 178.5 168.5 180.3 170.1 178.2 174.4 174.6 162.8 174.4 157.4 159.5 30-49 169.1 170.6 171.1 169.5 156.5 164.0 164.8 155.6 159.6 169.8 146.7 160.9 163.3 176.1 50-80 163.1 181.9 166.6 171.7 170.0 169.1 166.7 151.6 164.7 153.3 160.3 134.5 182.9 176.3 166.3 160.5 Pr>F Source DF Sum of squares Mean squares 222.0610 2365.0482 195.5803 111.0305 2.0403 0.1399 2365.0482 43.4607 <0.0001 Age Gender (1=M) Age*Gender (1=M) 97.7902 1.7970 0.1756
Female Male 161.8 18-29 161.2 170.2 162.9 155.5 168.0 153.3 152.0 154.9 172.8 178.7 183.1 175.9 177.5 170.5 180.1 178.6 178.5 165.4 178.5 168.5 180.3 170.1 178.2 174.4 174.6 162.8 174.4 157.4 159.5 30-49 169.1 170.6 171.1 169.5 156.5 164.0 164.8 155.6 159.6 169.8 146.7 160.9 163.3 176.1 50-80 163.1 181.9 166.6 171.7 170.0 169.1 166.7 151.6 164.7 153.3 160.3 134.5 182.9 176.3 166.3 160.5 Pr>F Source DF Sum of squares Mean squares 222.0610 2365.0482 195.5803 111.0305 2.0403 0.1399 2365.0482 43.4607 <0.0001 Age Gender (1=M) Age*Gender (1=M) 97.7902 1.7970 0.1756

MATLAB: An Introduction with Applications
6th Edition
ISBN:9781119256830
Author:Amos Gilat
Publisher:Amos Gilat
Chapter1: Starting With Matlab
Section: Chapter Questions
Problem 1P

Related questions
Topic Video
Question
Heights The heights (cm) in the following table are from Data Set 1 “Body Data” in Appendix B. Results from two-way analysis of variance are also shown. Use the displayed results and use a 0.05 significance level. What do you conclude?
XLSTAT
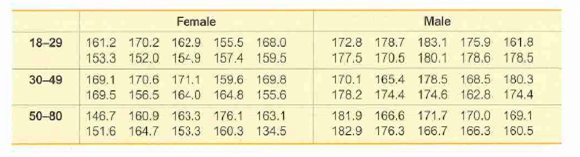
Transcribed Image Text:Female
Male
161.8
18-29
161.2 170.2 162.9 155.5 168.0
153.3 152.0 154.9
172.8 178.7 183.1 175.9
177.5
170.5 180.1 178.6 178.5
165.4 178.5 168.5 180.3
170.1
178.2 174.4 174.6 162.8 174.4
157.4 159.5
30-49
169.1 170.6 171.1
169.5 156.5 164.0 164.8 155.6
159.6 169.8
146.7 160.9 163.3 176.1
50-80
163.1
181.9 166.6 171.7 170.0 169.1
166.7
151.6 164.7 153.3 160.3 134.5
182.9 176.3
166.3 160.5
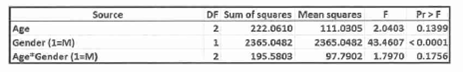
Transcribed Image Text:Pr>F
Source
DF Sum of squares Mean squares
222.0610
2365.0482
195.5803
111.0305 2.0403 0.1399
2365.0482 43.4607 <0.0001
Age
Gender (1=M)
Age*Gender (1=M)
97.7902 1.7970 0.1756
Expert Solution
This question has been solved!
Explore an expertly crafted, step-by-step solution for a thorough understanding of key concepts.

This is a popular solution!

Trending now
This is a popular solution!

Step by step
Solved in 2 steps

Knowledge Booster


Learn more about
Need a deep-dive on the concept behind this application? Look no further. Learn more about this topic, statistics and related others by exploring similar questions and additional content below.Recommended textbooks for you
MATLAB: An Introduction with Applications
Statistics
ISBN:
9781119256830
Author:
Amos Gilat
Publisher:
John Wiley & Sons Inc

Probability and Statistics for Engineering and th…
Statistics
ISBN:
9781305251809
Author:
Jay L. Devore
Publisher:
Cengage Learning

Statistics for The Behavioral Sciences (MindTap C…
Statistics
ISBN:
9781305504912
Author:
Frederick J Gravetter, Larry B. Wallnau
Publisher:
Cengage Learning
MATLAB: An Introduction with Applications
Statistics
ISBN:
9781119256830
Author:
Amos Gilat
Publisher:
John Wiley & Sons Inc
Probability and Statistics for Engineering and th…
Statistics
ISBN:
9781305251809
Author:
Jay L. Devore
Publisher:
Cengage Learning
Statistics for The Behavioral Sciences (MindTap C…
Statistics
ISBN:
9781305504912
Author:
Frederick J Gravetter, Larry B. Wallnau
Publisher:
Cengage Learning

Elementary Statistics: Picturing the World (7th E…
Statistics
ISBN:
9780134683416
Author:
Ron Larson, Betsy Farber
Publisher:
PEARSON

The Basic Practice of Statistics
Statistics
ISBN:
9781319042578
Author:
David S. Moore, William I. Notz, Michael A. Fligner
Publisher:
W. H. Freeman

Introduction to the Practice of Statistics
Statistics
ISBN:
9781319013387
Author:
David S. Moore, George P. McCabe, Bruce A. Craig
Publisher:
W. H. Freeman