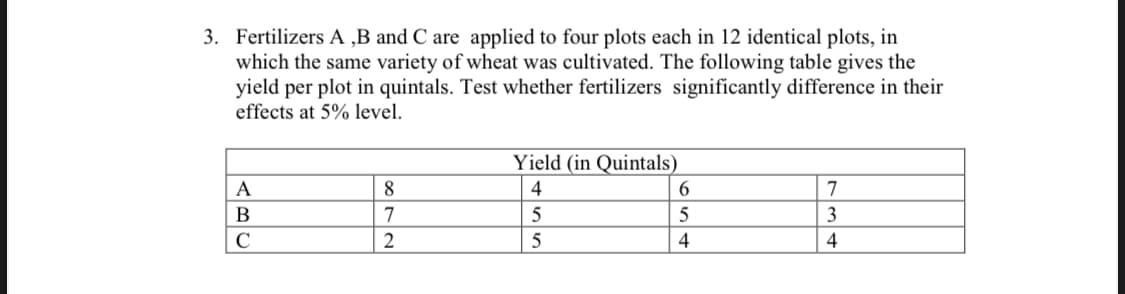
Fertilizers A ,B and C are applied to four plots each in 12 identical plots, in which the same variety of wheat was cultivated. The following table gives the yield per plot in quintals. Test whether fertilizers significantly difference in their effects at 5% level. Yield (in Quintals) A 8 4 7 7 5 3 C 5 4 4. 69


Q: 8 The distribution of the employees of a pharmaceutical company according to their monthly income…
A: For a frequency distribution, mode is the value with highest frequency. It is given by, where l1 is…
Q: Bruce helps answer mail for the mayor of Pineville. After the mayor visited his town's middle school…
A: To identify the correct box plot of the given data
Q: A researcher re-expressed a data set of scientific meas-urements. In the display shown, the upper…
A: Solution: The re-expressed box plot shows that the median value has decreased. This indicates that…
Q: 3. Fertilizers A ,B and C are applied to four plots each in 12 identical plots, in which the same…
A:
Q: The box-and-whisker plot below shows the heights, in inches, of the students in a 7th grade class.…
A: Solution is given below:
Q: The two box plots below summarize the weights of two populations of dogs, measured in pounds. Which…
A: Solution: From the given weights of dogs Population A: IQR = 6 - 4 = 2 Median = 5
Q: Using the box-and-whisker plot below, what is the interquartile range(IQR) of the gallons of paint…
A: Use the formula of IQR =Q3-Q1
Q: ++++ 10 20 30 40 50 60 70 80 90 100 Number of Guests per Day a) How many guests are represented on…
A: Minimum = 15 , Q1 = 30, Q2 = 45 , Q3 = 55, Maximum = 100
Q: Large Pizza Prices ($) 0 10 12 14 16 18 20 22 24 2 0 1 2 3 4 5 6 7 8 9 10 Number of Toppings What is…
A:
Q: Yvonne and her family went on a 10-day fishing trip. The data set below shows the number of fish…
A: Given data : 4 , 7 , 8 , 9 , 10 , 10 , 11 , 12 , 14 , 16 median = sum 5th term + 6th term2…
Q: Suppose automobile insurance companies gave annual premiums for top-rated companies in several…
A:
Q: 7. The line plot below shows the number of red items of clothing owned by each student in a class. X…
A: To find: The median of the given data. Calculation: Create a frequency distribution table. Class…
Q: Grintield Service company's marketing director is interested in analyzing the relationship between…
A:
Q: To investigate the relationship between yield of potatoes, y, and level of fertilizer application,…
A: The provided data set is:
Q: The data below are for two different types of straw seed that were used on adjacent plots of land.…
A:
Q: Population Ecology Wagner" collected the data found in the following table relating the percent…
A: Given information: The data represents the values of the percent mortality y of eggs of the…
Q: A random sample of ten professional athletes produced the following data where xis the number of…
A:
Q: Ramona's Garage charges the following labor rates. All customers are charged for at least 0.5 hr.…
A:
Q: The box plots above correspond to the results from three types of fertilizer. Which one has the…
A: Here Given the Box plots for 3 types of fertilizer
Q: When Air Jordan 1 shoes were first released, they were the highest priced sneaker on the market at…
A:
Q: 13 The data below represent the amount of grams of carbohydrates in a serving of breakfast cereal.…
A:
Q: Statistics students in Oxnard College sampled 11 textbooks in the Condor bookstore and recorded the…
A: Given data, X Y X*Y X*X 845 78.5 66332.5 714025 635 72.5 46037.5 403225 553 50.3 27815.9…
Q: (a) You are given two identical sets of data A and B with the largest value from the data set B…
A: This is what a box and whsker plot looks like.
Q: 2. A study on the number of hours nine people exercise each week and the amount of vitamin (in gram)…
A: Follows the below instructions to construct the scatter plot: EXCEL procedure: Go to EXCEL Go…
Q: When 20 employees were first hired in 2011 for a creative engineering firm, Company A, the starting…
A:
Q: 5. The scatter plot shows the ages of one kind of automobile at a used car lot and its resale value…
A: As the scatter plot shows that the resale value decreases linearly with the year increases.
Q: Tim took a random survey of 20 sixth graders and 20 eighth graders. He asked how many hours a week…
A: Dot plot is used to represent the observations and its frequency graphically. The observations are…
Q: Two athletes are training for a cycling race. Each athlete recorded the distance (in miles) of their…
A: Since we only do up to three sub parts of a problem, we'll be doing the first three sub parts only.…
Q: Tiffany is a manager who needs to fire the worst performing 3% of employees.At her…
A: We have to find z score value for given data..
Q: Use a stem-and-leat plot that has two rows for each stem to display the data, which represent the…
A: we have to construct steam and leaf plot..
Q: 6. A local hospital kept track one day of the blood type of their male and female patients. The…
A: 6) Given that : Frequency distribution is given. We use relative frequency formula R = fi /…
Q: The data below shows the number jobs that a sample of people had in their life time: 6 7 78 8 99 10…
A: Hello! As you have posted more than 3 sub parts, we are answering the first 3 sub-parts. In case…
Q: 15. Every coach and every athlete on the Douglas High School track team recorded how many miles s/he…
A: Solution:Given The boxplot of Athletes shows the approximate five number summary asMinimum = 12,…
Q: An agronomist wanted to compare the yield of three different varieties of rice (A, B, C). So, within…
A:
Q: of shipping d= c. Write the 5-number summary for this data. d. Create box plot.
A: The frequency distribution table that can be observed by looking at the given histogram is:…
Q: 7. The box-and-whisker plots show the Test Scores of five schools that have written a common exam.…
A: Given a test score of five school by graph
Q: 2 1 5 31 1 3 49 9 40 2 9 5 5 6 1 2 Evaluate the following for the actual data value from the stem…
A: Given , 1 8 9 2 1 5 3 1 1 3 4 9 9 4 0 2 9 5 5 6 1 2
Q: The box plot represents the number of minutes it takes for the students in a class to run a mile.…
A: We can find the minimum of the data as following.
Q: 6. Mr. Landis created a box and whisker plot to represent the scores his students made on the final…
A: PLOT THE GIVEN DATA AND WE GET AS SHOWN BELOW
Q: To investigate the relationship between yield of potatoes, y, and level of fertilizer application,…
A: Note: Hey, since there are multiple subparts are posted, we will answer first three subparts for…
Q: 2. Chloe compares the growth of plant species A and B. Plant AH Plant BH ++++++ HHH 0 1 2 3 4 5 6 7…
A:
Q: Aiden receives a z score of –.3 on an exam that is normally distributed, what percentage of the…
A:
Q: Height (inch) Shoe size 67 8.5 9.5 70 73.5 11 75 78 12 13 66 8
A: Solution-: Draw the scatter plots best describes the given data.
Q: Find the average price and med Price Per Number of Item Items $13 4 $16 $17 8. $22 6. Average price:…
A: the given data is as follows Price Per item (x) number of items (f) cumulative frequency cf 13…
Q: Hello! I need help with this particular question on my study guide. There is an attachment below.…
A: The box plot contains 5-number summary. That is, the minimum value, the first quartile, the second…
Q: 2) For each of the scatterplots below, CIRCLE the words that most correctly describe the…
A:
Q: The dot plots show the number of hours two students watched television in the month of June. .. 15…
A: Median is one of the statistical measures of central tendency. When we have a sorted dataset, then…
Q: A biologist looked at the relationship between number of seeds a plant produces and the percent of…
A: The estimated regression line is as follows:
Q: In an agricultural experiment, the effects of two fertilizers on the production of limes were…
A: Given data, New Fertilizer Old Fertilizer 412 480 434 472 436 485 418…
Q: A high school has 44 players on the football team. The summary of the players' weights is given in…
A: Given that - A high school has 44 players on the football team. The summary of the players' weights…

Step by step
Solved in 3 steps with 2 images


- The data below are for two different types of straw seed that were used on adjacent plots of land. The listed values are the yields of straw in cwt (100 lb, or hundredweight) per acre, and the yields are paired by the plot of land that they share. Complete parts (a) through (c). Type 1 Type 219.25 2523 23.7522.75 24.2522.75 28.2522.25 22.7519.5 19.7524.5 22.2515.5 1618 17.2514 1617 17.25 Using a 0.05 significance level, test the claim that there is no difference between the yields from the two types of seed. Let mu Subscript dμdbe the mean of the population of differences of type 1 minus type 2 and write the hypotheses. The null hypothesis is Upper H 0H0: Upper H 1H1: The test statistic is State the conclusion that addresses the original claim.An agronomist undertook an experiment to investigate the factors that potato harvest. In his research, agronomist decided to divide the farm into 30 half hectare plots and apply varies level of fertilizer. Potato was then planted and the harvest at the end of the season was recorded. Fertilizer(Kg) Harvest (tons) 210 43.5 220 40.0 230 48.0 240 65.0 250 80.0 260 85.0 270 95.0 280 80.0 290 97.3 Note: No excel ANOVA output allowed. Students need to show all the steps in calculations. You are required to; Find the simple regression line and interpret the coefficients. Find the coefficient of determination and interpret its value. Does the model appear to be a useful tool in predicting the potato harvest? If so, predict the harvest when 250KG of fertilizer is applied. If not explain why not.n an effort to determine whether a new type of fertilizer is more effective than the type currently in use, researchers took 5 two-acre plots of land scattered throughout the village. Each plot was divided into two equal-size subplots, one of which was treated with the current fertilizer and the other of which was treated with the new fertilizer. Wheat was planted, and the crop yields were measured given in the following table Plot 1 2 3 4 5 Current Fertilizer 56 45 69 57 60 New Fertilizer 49 66 61 58 75 Can we conclude at the 5% significance level that the new fertilizer is more effective than the current one?
- A well-known maker of jams and jellies packages its jams in jars labeled "~250 milliliters." The process used to fill the jars is known to dispense an amount of jam that is a Normally distributed variable µ = 252 milliliters and σ = 0.9 milliliters. What proportion of jars will be filled with what the label claims is 250 milliliters?the soil biogeochemistry in Californian salt marshes wished to explore how two of the most common plant species, pickleweed and pacific cordgrass, affected the accumulation of nitrogen in the soil. They measured the concentration of ammonium, a molecular form of organic nitrogen, in the soil, and measured or manipulated the density of pickleweed and cordgrass. Manipulations of ½ meter square plots (20 plots per manipulation) included removing all cordgrass (cordgrass removal), removing all pickleweed (pickleweed removal), or mixed (the control - nothing removed, thus mixed plots included a mixture of natural pickleweed and cordgrass). Boxplots of ammonium concentrations in each of the three manipulation treatments. Letters indicate differences among means as determined by a Tukey posthoc test following ANOVA. (b) Overall relationship between cordgrass stem density and soil ammonium content (includes data from all plot treatments). The solid black line and the gray shading represent the…M&M’s The candy company claims that 16% of theMilk Chocolate M&M’s it produces are green. Supposethat the candies are thoroughly mixed and then packagedin small bags containing about 50 M&M’s. A class ofelementary school students learning about percents opensseveral bags, counts the various colors of the candies, andcalculates the proportion that are green.a) If we plot a histogram showing the proportions ofgreen candies in the various bags, what shape wouldyou expect it to have?b) Can that histogram be approximated by a Normalmodel? Explain.c) Where should the center of the histogram be?d) What should the standard deviation of the samplingdistribution be?
- If you know that the average number of mistakes on a math test is 12, with a standarddeviation of 3, determine the following:a.) Joe makes 19 mistakes on his test. Find Joe’s z-scoreb.) Using the z-score table, determine what percentage of the exams have fewer mistakesthan Joe’s number of mistakes.c.) Is Joe an outlier?d.) If Suzie Que makes 5 mistakes on her test, what is her z-score?e.) Using the z-score table, what percentage of the exams have fewer mistakes than SuzieQue’s number of mistakes?f.) Is Suzie Que an outlier?In a given community, a survey was conducted to determine whether there is any relationship between the size of one’s yearly income x (in hundred thousands of pesos) and the size of one’s home y (in hundreds of square meters). The data were collected for 10 samples. x. Income 41.2 68.3 22.4 56.7 42.2 86.1 50.3 35.7 44.4 47.5 y, Home size 2.9 3.5 2.5 3.1 3.3 4 3.7 2.9 3 3.1 a.) Find the correlation coefficient r between income and home size b.) Determine the equation of the regression line of home size on c.) Determine the home size of a person with an annual income of Php 4,000,000.00A manufacturing company is interested in predicting the number of defects that will be produced each hour on the assembly line. The managers believe that there is a relationship between the defect rate and the production rate per hour. The managers believe that they can use production rate to predict the number of defects. The following data were collected for 10 randomly selected hours. Defects (Y) Production rate per hour(X) 2 40 3 45 1 35 2 37 3 40 2 40 3 45 2 30 1 30 4 30 (a). Construct a scatter plot diagram and comment on the relationship between y and x (b). Calculate the correlation coefficient (r) between x and y and comment on the result. (c). Find the coefficient of determination and interpret the result.
- A restaurant owner wants to compare the average delivery times for his 4 french restaurants. Over the course of a few weeks, he orders a number of dishes from each restaurant, and he records the time it takes for each dish to be delivered. a) A partial ANOVA table for his data is shown below. What is the value of B? Source DF SS MS F P-value Treatment B 28.891 D F G Error C 16.56 E Total 20 45.451 b) What is the value of C in the ANOVA table? c) What is the value of D in the ANOVA table? d) What is the value of E in the ANOVA table? e) What is the value of F in the ANOVA table? f) What is the value of G in the ANOVA table?The box plot below summarizes the heights (in centimeters) of a sample of 200 3-year-old males in the United States. Which of the following statements is false? (A) 50% of the children in the sample had heights between 93 and 98 cm. (B) 25 children had heights greater than 98 cm. (C) The 25th percentile in this sample is a height of 93 cm. (D) The tallest child in this sample was 111 cm tall. (E) Every child in the sample was at least 82 cm tall.Samples are collected from the River X and pH values are observed. 9 different pH values are listed in table 3. Table 3 Concentrations 3.55 4.01 5.38 3.22 8.05 5.25 4.67 3.67 3.5Draw box plot and find a. Bowley’s coefficient of skewness b. Karl Pearson’s coefficient of skewness c. Third moment Rubric Stages of Process Marks Imagine and Plan 2Composition 2Effort 1
