FIFO versus LIFO: Ratio Analysis. Presented below is financial data for two companies that are identical in every respect except that Company X uses the FIFO method to value its inventory and Company Z uses the LIFO method to value its inventory. Using this data, calculate the following ratios: return on sales, inventory turnover, inventory-on-hand period, and current ratio. Which of the two companies is the better investment opportunity? Why? Company X Company Z Sales... $110,000 49,500 27,750 21,000 64,000 $110,000 Cost of goods sold Net income .. Inventory. 60,000 17,250 10,500 53,500 22,000 Current assets Current liabilities.. 22,000
FIFO versus LIFO: Ratio Analysis. Presented below is financial data for two companies that are identical in every respect except that Company X uses the FIFO method to value its inventory and Company Z uses the LIFO method to value its inventory. Using this data, calculate the following ratios: return on sales, inventory turnover, inventory-on-hand period, and current ratio. Which of the two companies is the better investment opportunity? Why? Company X Company Z Sales... $110,000 49,500 27,750 21,000 64,000 $110,000 Cost of goods sold Net income .. Inventory. 60,000 17,250 10,500 53,500 22,000 Current assets Current liabilities.. 22,000

Fundamentals of Financial Management, Concise Edition (MindTap Course List)
9th Edition
ISBN:9781305635937
Author:Eugene F. Brigham, Joel F. Houston
Publisher:Eugene F. Brigham, Joel F. Houston
Chapter9: Stocks And Their Valuation
Section: Chapter Questions
Problem 5DQ

Related questions
Question
Using this data, calculate the following ratios: return on sales, inventory turnover, inventory-on-hand period, and
Transcribed Image Text:E6.16
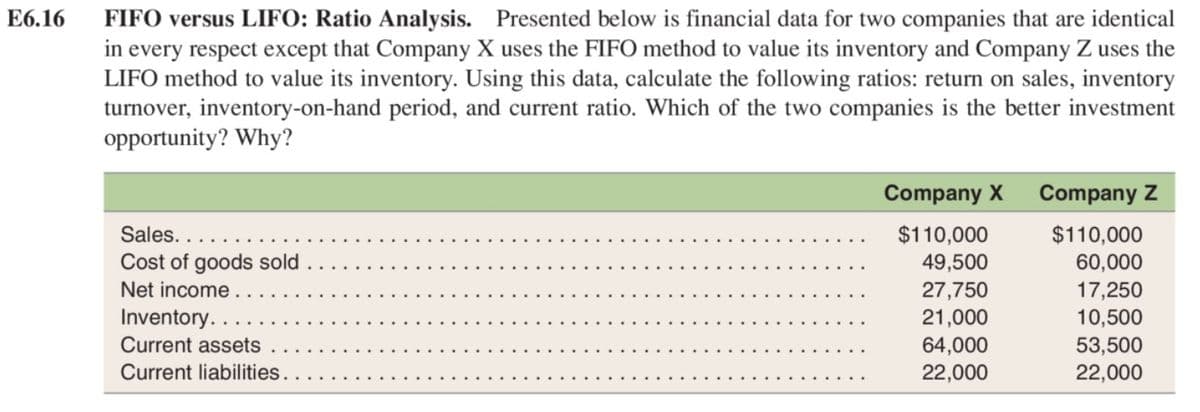
FIFO versus LIFO: Ratio Analysis. Presented below is financial data for two companies that are identical
in every respect except that Company X uses the FIFO method to value its inventory and Company Z uses the
LIFO method to value its inventory. Using this data, calculate the following ratios: return on sales, inventory
turnover, inventory-on-hand period, and current ratio. Which of the two companies is the better investment
opportunity? Why?
Company X
Company Z
Sales...
$110,000
$110,000
Cost of goods sold
49,500
60,000
Net income.
27,750
21,000
17,250
Inventory.
Current assets
10,500
53,500
22,000
64,000
Current liabilities.
22,000
Expert Solution
This question has been solved!
Explore an expertly crafted, step-by-step solution for a thorough understanding of key concepts.

This is a popular solution!

Trending now
This is a popular solution!

Step by step
Solved in 2 steps

Knowledge Booster


Learn more about
Need a deep-dive on the concept behind this application? Look no further. Learn more about this topic, accounting and related others by exploring similar questions and additional content below.Recommended textbooks for you
Fundamentals of Financial Management, Concise Edi…
Finance
ISBN:
9781305635937
Author:
Eugene F. Brigham, Joel F. Houston
Publisher:
Cengage Learning

Fundamentals of Financial Management, Concise Edi…
Finance
ISBN:
9781285065137
Author:
Eugene F. Brigham, Joel F. Houston
Publisher:
Cengage Learning

Managerial Accounting: The Cornerstone of Busines…
Accounting
ISBN:
9781337115773
Author:
Maryanne M. Mowen, Don R. Hansen, Dan L. Heitger
Publisher:
Cengage Learning
Fundamentals of Financial Management, Concise Edi…
Finance
ISBN:
9781305635937
Author:
Eugene F. Brigham, Joel F. Houston
Publisher:
Cengage Learning
Fundamentals of Financial Management, Concise Edi…
Finance
ISBN:
9781285065137
Author:
Eugene F. Brigham, Joel F. Houston
Publisher:
Cengage Learning
Managerial Accounting: The Cornerstone of Busines…
Accounting
ISBN:
9781337115773
Author:
Maryanne M. Mowen, Don R. Hansen, Dan L. Heitger
Publisher:
Cengage Learning

College Accounting, Chapters 1-27 (New in Account…
Accounting
ISBN:
9781305666160
Author:
James A. Heintz, Robert W. Parry
Publisher:
Cengage Learning

Cornerstones of Financial Accounting
Accounting
ISBN:
9781337690881
Author:
Jay Rich, Jeff Jones
Publisher:
Cengage Learning

Financial Reporting, Financial Statement Analysis…
Finance
ISBN:
9781285190907
Author:
James M. Wahlen, Stephen P. Baginski, Mark Bradshaw
Publisher:
Cengage Learning