Glaucoma is a leading cause of blindness in the United States, N. Ehlers measured the difference in corneal thickness (in microns) between the two eyes of eight patients. Each patient had one eye that had glaucoma and one eye that was normal. The difference was measured as the corneal thickness of normal eye – corneal thickness of eye with Glaucoma. Corneal thickness is important because it can mask an accurate reading of eye pressure. Use ? = .05. Q) If a participant has the same corneal thickness in their normal eye as the eye with Glaucoma, what would be the value for difference: measured as the corneal thickness of normal eye – corneal thickness of eye with Glaucoma.
Glaucoma is a leading cause of blindness in the United States, N. Ehlers measured the difference in corneal thickness (in microns) between the two eyes of eight patients. Each patient had one eye that had glaucoma and one eye that was normal. The difference was measured as the corneal thickness of normal eye – corneal thickness of eye with Glaucoma. Corneal thickness is important because it can mask an accurate reading of eye pressure. Use ? = .05. Q) If a participant has the same corneal thickness in their normal eye as the eye with Glaucoma, what would be the value for difference: measured as the corneal thickness of normal eye – corneal thickness of eye with Glaucoma.

Glencoe Algebra 1, Student Edition, 9780079039897, 0079039898, 2018
18th Edition
ISBN:9780079039897
Author:Carter
Publisher:Carter
Chapter10: Statistics
Section: Chapter Questions
Problem 25SGR

Related questions
Question
100%
Glaucoma is a leading cause of blindness in the United States, N. Ehlers measured
the difference in corneal thickness (in microns) between the two eyes of eight patients.
Each patient had one eye that had glaucoma and one eye that was normal. The
difference was measured as the corneal thickness of normal eye – corneal thickness
of eye with Glaucoma. Corneal thickness is important because it can mask an
accurate reading of eye pressure.
Use ? = .05.
Q) If a participant has the same corneal thickness in their normal eye as the
eye with Glaucoma, what would be the value for difference: measured as
the corneal thickness of normal eye – corneal thickness of eye with
Glaucoma.
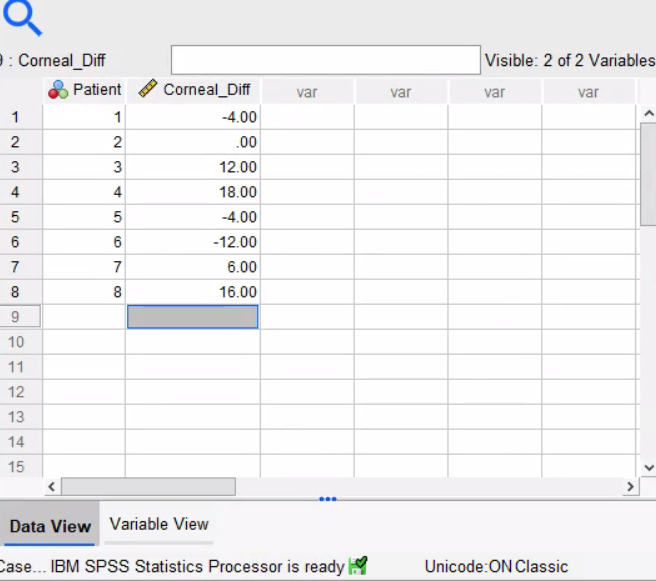
Transcribed Image Text:: Corneal_Diff
Visible: 2 of 2 Variables
Patient
Corneal Diff
var
var
var
var
1
1
-4.00
2
.00
3
12.00
4
4
18.00
5
-4.00
6
6
-12.00
7
6.00
8
8
16.00
9
10
11
12
13
14
15
Data View Variable View
Case... IBM SPSS Statistics Processor is ready
Unicode:ON Classic
3.
7.
2.
Transcribed Image Text:tatistics Viewer
sform
Įnsert
Format
Analyze
Graphs
Utilities
Extensions
Window
Help
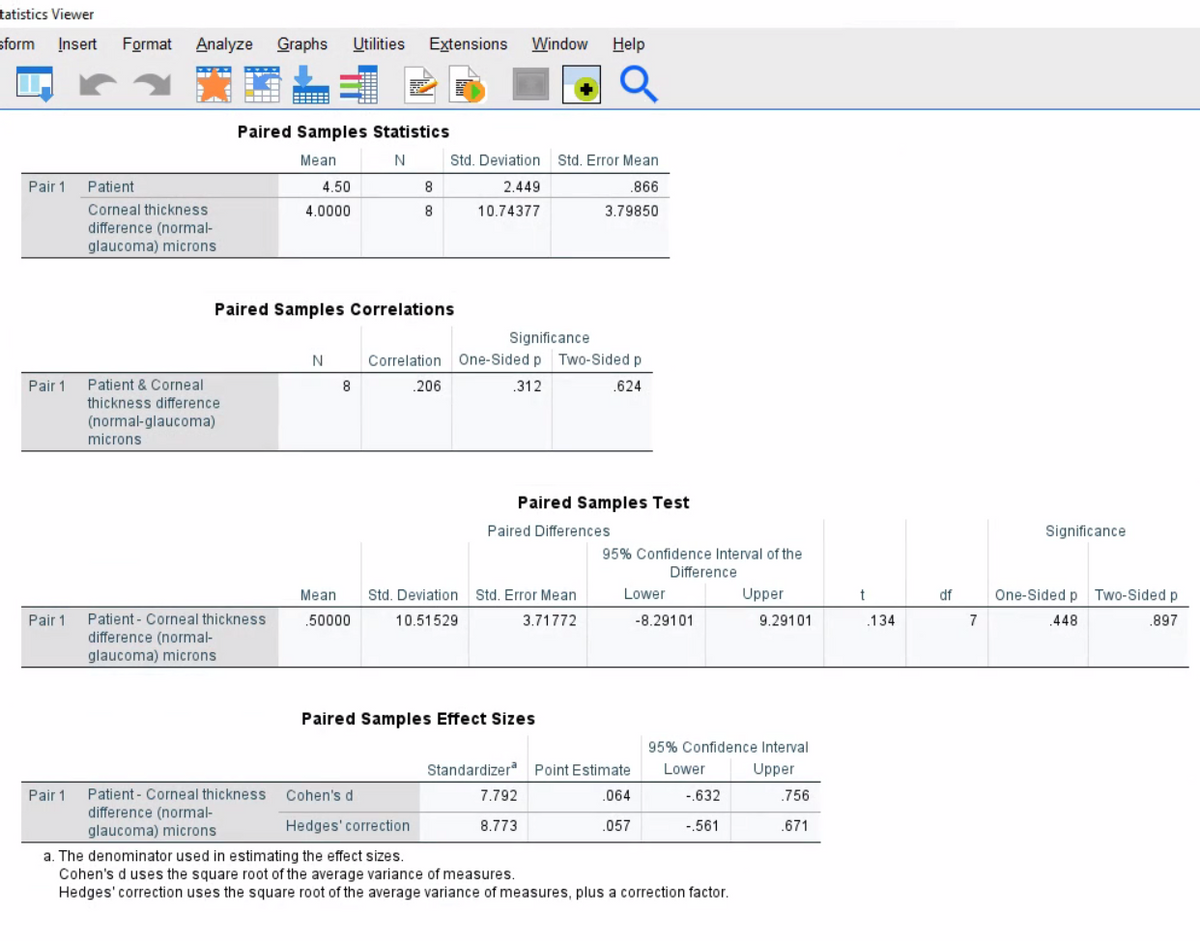
Paired Samples Statistics
Mean
Std. Deviation
Std. Error Mean
Pair 1
Patient
4.50
8
2.449
.866
Corneal thickness
4.0000
8
10.74377
3.79850
difference (normal-
glaucoma) microns
Paired Samples Correlations
Significance
Correlation One-Sided p Two-Sided p
Pair 1
Patient & Corneal
8
.206
312
.624
thickness difference
(normal-glaucoma)
microns
Paired Samples Test
Paired Differences
Significance
95% Confidence Interval of the
Difference
Mean
Std. Deviation
Std. Error Mean
Lower
Upper
df
One-Sided p Two-Sided p
Pair 1
Patient - Corneal thickness
.50000
10.51529
3.71772
-8.29101
9.29101
.134
7
.448
.897
difference (normal-
glaucoma) microns
Paired Samples Effect Sizes
95% Confidence Interval
Standardizer Point Estimate
Lower
Upper
Pair 1
Patient - Corneal thickness
Cohen's d
7.792
.064
-.632
.756
difference (normal-
glaucoma) microns
Hedges' correction
8.773
.057
-.561
.671
a. The denominator used in estimating the effect sizes.
Cohen's d uses the square root of the average variance of measures.
Hedges' correction uses the square root of the average variance of measures, plus a correction factor.
Expert Solution
This question has been solved!
Explore an expertly crafted, step-by-step solution for a thorough understanding of key concepts.

This is a popular solution!

Trending now
This is a popular solution!

Step by step
Solved in 2 steps

Recommended textbooks for you
Glencoe Algebra 1, Student Edition, 9780079039897…
Algebra
ISBN:
9780079039897
Author:
Carter
Publisher:
McGraw Hill
Glencoe Algebra 1, Student Edition, 9780079039897…
Algebra
ISBN:
9780079039897
Author:
Carter
Publisher:
McGraw Hill