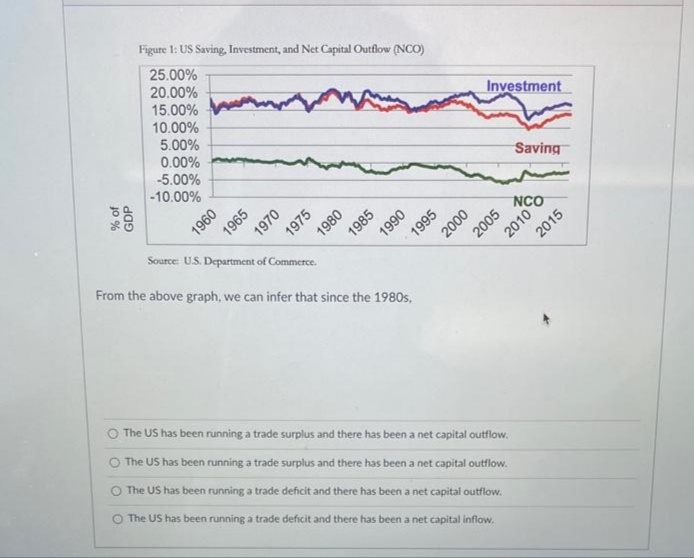
Figure 1: US Saving, Investment, and Net Capital Outflow (NCO) 25.00% 20.00% 15.00% 10.00% 5.00% Investment 0.00% Saving -5.00% -10.00% 2015 Source: US. Department of Commerce. From the above graph, we can infer that since the 1980s, O The US has been running a trade surplus and there has been a net capital outflow. The US has been running a trade surplus and there has been a net capital outflow. O The US has been running a trade deficit and there has been a net capital outflow. The US has been running a trade deficit and there has been a net capital inflow. % of GDP 1960 1965 1970 1975 1980 1985 1990 1995 2000 2005 2010
Figure 1: US Saving, Investment, and Net Capital Outflow (NCO) 25.00% 20.00% 15.00% 10.00% 5.00% Investment 0.00% Saving -5.00% -10.00% 2015 Source: US. Department of Commerce. From the above graph, we can infer that since the 1980s, O The US has been running a trade surplus and there has been a net capital outflow. The US has been running a trade surplus and there has been a net capital outflow. O The US has been running a trade deficit and there has been a net capital outflow. The US has been running a trade deficit and there has been a net capital inflow. % of GDP 1960 1965 1970 1975 1980 1985 1990 1995 2000 2005 2010

Brief Principles of Macroeconomics (MindTap Course List)
8th Edition
ISBN:9781337091985
Author:N. Gregory Mankiw
Publisher:N. Gregory Mankiw
Chapter14: A Macroeconomic Theory Of The Open Economy
Section: Chapter Questions
Problem 1CQQ

Related questions
Question
Transcribed Image Text:Figure 1: US Saving, Investment, and Net Capital Outflow (NCO)
25.00%
20.00%
15.00%
10.00%
5.00%
Investment
0.00%
-5.00%
-10.00%
Saving
Source: US. Department of Commerce.
1990
2005
2015
From the above graph, we can infer that since the 1980s,
The US has been running a trade surplus and there has been a net capital outflow.
The US has been running a trade surplus and there has been a net capital outflow.
O The US has been running a trade deficit and there has been a net capital outflow.
O The US has been running a trade deficit and there has been a net capital inflow.
% of
GDP
1960
1965
1970
1975
1980
1985
1995
2000
2010%
Expert Solution
This question has been solved!
Explore an expertly crafted, step-by-step solution for a thorough understanding of key concepts.

Step by step
Solved in 2 steps

Recommended textbooks for you
Brief Principles of Macroeconomics (MindTap Cours…
Economics
ISBN:
9781337091985
Author:
N. Gregory Mankiw
Publisher:
Cengage Learning

Principles of Economics (MindTap Course List)
Economics
ISBN:
9781305585126
Author:
N. Gregory Mankiw
Publisher:
Cengage Learning

Principles of Macroeconomics (MindTap Course List)
Economics
ISBN:
9781305971509
Author:
N. Gregory Mankiw
Publisher:
Cengage Learning
Brief Principles of Macroeconomics (MindTap Cours…
Economics
ISBN:
9781337091985
Author:
N. Gregory Mankiw
Publisher:
Cengage Learning
Principles of Economics (MindTap Course List)
Economics
ISBN:
9781305585126
Author:
N. Gregory Mankiw
Publisher:
Cengage Learning
Principles of Macroeconomics (MindTap Course List)
Economics
ISBN:
9781305971509
Author:
N. Gregory Mankiw
Publisher:
Cengage Learning

Principles of Macroeconomics (MindTap Course List)
Economics
ISBN:
9781285165912
Author:
N. Gregory Mankiw
Publisher:
Cengage Learning

Principles of Economics, 7th Edition (MindTap Cou…
Economics
ISBN:
9781285165875
Author:
N. Gregory Mankiw
Publisher:
Cengage Learning

Principles of Economics 2e
Economics
ISBN:
9781947172364
Author:
Steven A. Greenlaw; David Shapiro
Publisher:
OpenStax