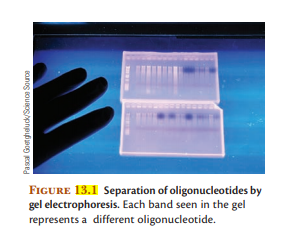
FIGURE 13.1 Separation of oligonucleotides by gel electrophoresis. Each band seen in the gel represents a different oligonucleotide. Banog Bouaospnpipo ose
FIGURE 13.1 Separation of oligonucleotides by gel electrophoresis. Each band seen in the gel represents a different oligonucleotide. Banog Bouaospnpipo ose

Introduction to General, Organic and Biochemistry
11th Edition
ISBN:9781285869759
Author:Frederick A. Bettelheim, William H. Brown, Mary K. Campbell, Shawn O. Farrell, Omar Torres
Publisher:Frederick A. Bettelheim, William H. Brown, Mary K. Campbell, Shawn O. Farrell, Omar Torres
Chapter31: Immunochemistry
Section: Chapter Questions
Problem 31.26P

Related questions

Question
How can we quantify the amount of energy required to generate a concentration gradient (Figure 13.1)?
Transcribed Image Text:FIGURE 13.1 Separation of oligonucleotides by
gel electrophoresis. Each band seen in the gel
represents a different oligonucleotide.
Banog Bouaospnpipo ose
Expert Solution
This question has been solved!
Explore an expertly crafted, step-by-step solution for a thorough understanding of key concepts.

Step by step
Solved in 2 steps

Knowledge Booster


Learn more about
Need a deep-dive on the concept behind this application? Look no further. Learn more about this topic, chemistry and related others by exploring similar questions and additional content below.Recommended textbooks for you
Introduction to General, Organic and Biochemistry
Chemistry
ISBN:
9781285869759
Author:
Frederick A. Bettelheim, William H. Brown, Mary K. Campbell, Shawn O. Farrell, Omar Torres
Publisher:
Cengage Learning


Organic Chemistry
Chemistry
ISBN:
9781305580350
Author:
William H. Brown, Brent L. Iverson, Eric Anslyn, Christopher S. Foote
Publisher:
Cengage Learning
Introduction to General, Organic and Biochemistry
Chemistry
ISBN:
9781285869759
Author:
Frederick A. Bettelheim, William H. Brown, Mary K. Campbell, Shawn O. Farrell, Omar Torres
Publisher:
Cengage Learning
Organic Chemistry
Chemistry
ISBN:
9781305580350
Author:
William H. Brown, Brent L. Iverson, Eric Anslyn, Christopher S. Foote
Publisher:
Cengage Learning