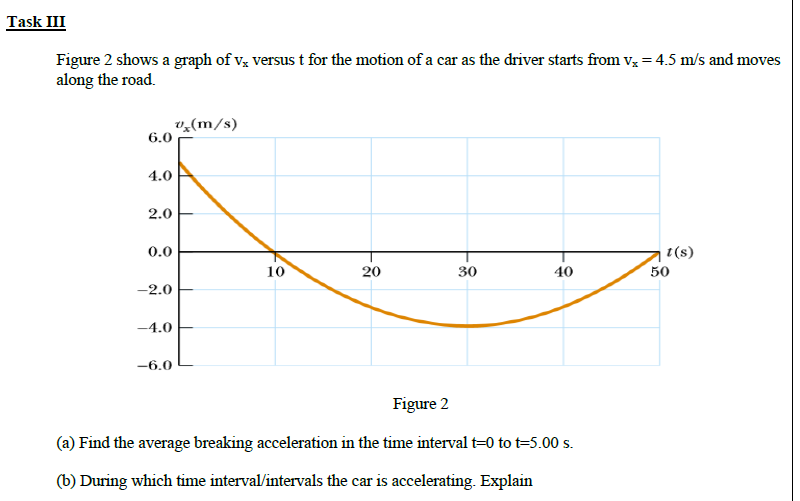
Figure 2 shows a graph of v; versus t for the motion of a car as the driver starts from vz = 4.5 m/s and moves along the road. v,(m/s) 6.0 4.0 2.0 0.0 1(s) 50 10 20 30 40 -2.0 -4.0 -6.0 Figure 2 (a) Find the average breaking acceleration in the time interval t=0 to t=5.00 s. (b) During which time interval/intervals the car is accelerating. Explain
Figure 2 shows a graph of v; versus t for the motion of a car as the driver starts from vz = 4.5 m/s and moves along the road. v,(m/s) 6.0 4.0 2.0 0.0 1(s) 50 10 20 30 40 -2.0 -4.0 -6.0 Figure 2 (a) Find the average breaking acceleration in the time interval t=0 to t=5.00 s. (b) During which time interval/intervals the car is accelerating. Explain

Physics for Scientists and Engineers, Technology Update (No access codes included)
9th Edition
ISBN:9781305116399
Author:Raymond A. Serway, John W. Jewett
Publisher:Raymond A. Serway, John W. Jewett
Chapter2: Motion In One Dimension
Section: Chapter Questions
Problem 2.2OQ: A racing car starts from rest at t = 0 and reaches a final speed at time t. II the acceleration of...

Related questions

Concept explainers
Question
PLEASE COULD ANYONE ANSWER THIS QUESTION
Transcribed Image Text:Figure 2 shows a graph of v; versus t for the motion of a car as the driver starts from vz = 4.5 m/s and moves
along the road.
v,(m/s)
6.0
4.0
2.0
0.0
1(s)
50
10
20
30
40
-2.0
-4.0
-6.0
Figure 2
(a) Find the average breaking acceleration in the time interval t=0 to t=5.00 s.
(b) During which time interval/intervals the car is accelerating. Explain
Expert Solution
This question has been solved!
Explore an expertly crafted, step-by-step solution for a thorough understanding of key concepts.

This is a popular solution!

Trending now
This is a popular solution!

Step by step
Solved in 3 steps with 3 images

Knowledge Booster


Learn more about
Need a deep-dive on the concept behind this application? Look no further. Learn more about this topic, physics and related others by exploring similar questions and additional content below.Recommended textbooks for you
Physics for Scientists and Engineers, Technology …
Physics
ISBN:
9781305116399
Author:
Raymond A. Serway, John W. Jewett
Publisher:
Cengage Learning
Physics for Scientists and Engineers, Technology …
Physics
ISBN:
9781305116399
Author:
Raymond A. Serway, John W. Jewett
Publisher:
Cengage Learning