Figure 3-16 Price P2 A P1 Q1 Q2 Quantity 
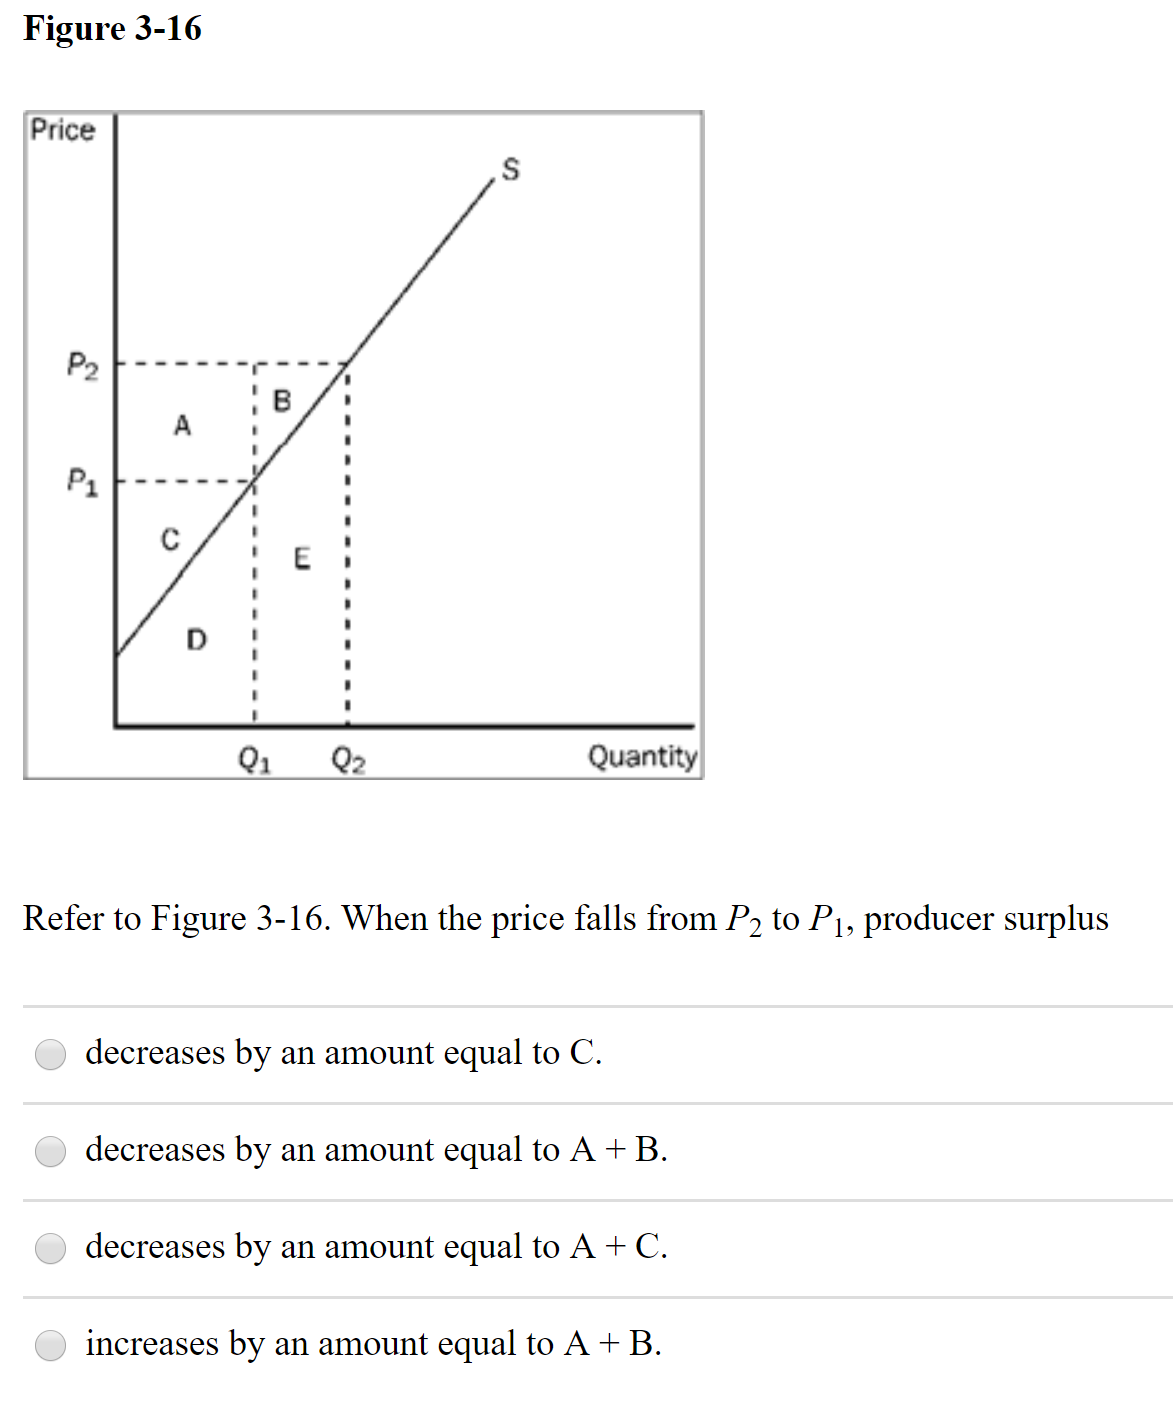
Refer to Figure 3-16. When the price falls from P2 to P1, producer surplus decreases by an amount equal to C. decreases by an amount equal to A + B. decreases by an amount equal to A + C. increases by an amount equal to A + B.
Q: Price $25.00 20.00 15.00 10.00 200 400 500 600 700 800 Quantity Refer to figure above. If the price…
A:
Q: Consider a market in which demand and supply functions are given as Qd = 300-20P Qs =, 20P-100…
A: Answer: Given, Qd=300-20PQs=20P-100 (1). Equilibrium in any market occurs where quantity demand is…
Q: Producer surplus from a unit of output is the difference between the market price and the seller's…
A: Below curve shows the producer surplus and consumer surplus:
Q: ct all that apply. A. It will cause a Surplus B. It will cause a Shortage C. Producer Surplus will…
A: Market refers to a place where good & services are bought & sold. Here the main medium of…
Q: 18. Refer to Table 4-6. If the price were $4, a a. shortage of 10 units would exist, and price…
A: Quantity demanded refers to the overall amount of an item or service that consumers demand during a…
Q: FIGURE 4-5 Maximum allowed price D Quantity of Gasoline Refer to Figure 4-5. What is occurring in…
A: Price floor is legal minimum price that can be charged for a good whereas price ceiling is a legal…
Q: The quantity that maximise total surplus (the sum of consumer and producer surplus) is__? Because…
A:
Q: 180 150 120 110 Supply 90 60 30 Demand 5 10 15 20 25 30 QUANTITY At the equilibrium price, producer…
A: Producer surplus is the area below the market price line and above the supply curve.
Q: A higher price increases producer surplus. True False
A: Producer surplus is the amount of surplus or welfare that the suppliers of a commodity extract from…
Q: The number of seats in a concert hall is 100. The government decided to levy a tax of $20 per…
A: Deadweight loss occurs due to an inefficient allocation of resources in the economy.
Q: Consider the following demand and supply curves: Demand: Price = 100-5Qd Supply: Price 5Qs Given…
A:
Q: Suppose the following demand and supply function: Qd = 750 – 25P Qs = -300 + 20 P i. Find…
A: Given: Demand function: Qd = 750 -25P Supply function: Qs = -300 +20P To Find: The equilibrium…
Q: Consider a market where demand and supply satisfy the following equations QD = 12 – 2 P, QS = 2P.…
A: QD=12-2PQS=2P Find: Price floor that maximizes producer surplus. Solution: When market is in…
Q: Question A winery produce x thousand bottles of premium wine when the price for each bottle is…
A: We are going to solve equilibrium state for the given question.
Q: Price $25.00 20.00 15.00 10.00 200 400 500 600 700 800 Quantity Refer to Figure 3-4. If the price is…
A: At Equilibrium Price, quantity demanded is equal to quantity supplied. Shortage occurs when quantity…
Q: Consumer surplus plus producer surplus equals O a) tax revenue. O b) economic profit. Oc) market…
A: Consumer surplus refers to the area above the price and below the demand curve. Producer surplus…
Q: Suppose $55 is the equilibrium price in the bicycle market. The equilibrium quantity is 30 bicycles.…
A: The consumer surplus is given as the area of the triangle above the equilibrium price and line and…
Q: Figure Producer Surplus Price P1 B P2 E P3 F Quantity Identify the area that represent the…
A: The difference between how much a producer is willing to pay for a given quantity of an item and how…
Q: price demanded= 20-q price suplied=q calculating the new equilibrium price will be 10 if the…
A: In a market, producer surplus is the benefit gained by a producer when selling price is kore than…
Q: Producer surplus is measured using the demand curve for a good. always a negative number for sellers…
A: Generation by market prices being in excess of the lowest price level producers would, in turn, be…
Q: PRICE P. Refer to Figure 7-1. Area C represents the Ca. decrease in consumer surplus which results…
A:
Q: given that market demand curve is P(Q)= 815-2Q , market supply curve p(Qs)=10+0.5Qs. In a market…
A: Given that, demand curve is P(Q)= 815-2Q , market supply curve p(Qs)=10+0.5Qs. In a market…
Q: 1. Draw the producer surplus with the following information: A. Equilibrium Price 100 B. Equilibrium…
A: Equilibrium is achieved at a point where demand is equal to supply. Producer surplus refers to the…
Q: Figure 7-6 Supply D QUANTITY Refer to Figure 7-6. When the price is P 2, producer surplus is O a.…
A: The supply curve shows the association between the price of commodity and quantity of the commodity…
Q: Calculate the producer surplus if a price ceiling of $5 is implemented. Answer:
A: When price ceiling of 5$ is implemented, the producer surplus will be zero because the producer will…
Q: Consider the following market demand and supply: Demand: P = 13 - 5Qd Supply: P = 6 + 2Qs If the…
A: Demand: - Demand is the relationship between the quantity demanded and the price of a good. There is…
Q: Question 4 Suppose that in a hypothetical economic setting, the demand curve iP = 50 – 0.1Q -nd the…
A: Given PD = 50 - 0.1Q (Demand) PS = 0.2Q + 20 (Supply)
Q: 180 150 120 110 Supply 90 70 60 Demand 10 15 20 25 30 QUANTITY At the equilibrium price, producer…
A: Producer surplus is the area below Market price line and above supply curve.
Q: Calculate the price observed in the market The consumer surplus The producer surplus Deadweight…
A: The equilibrium price and quantity of a good sold in the market are determined by the forces of…
Q: Consider a market where demand and supply satisfy the following equations QD = 12 – 2 P, QS = 2P.…
A: Producers surplus is the difference between the actual market price of a product and the minimum…
Q: Consider a market for books. Demand is given by Qp=120-P. Supply is given by Qs=5P. The equilibrium…
A: "Since you have asked a question with multiple sub-parts, we will solve first three sub-parts for…
Q: Supply B G P, Q, QUANTITY Refer to Figure 7-4. Which area represents the increase in producer…
A: Producer surplus Is that surplus which are lies below the price level and above the supply curve.…
Q: Choose the best statement. ... A. Producer surplus equals the total revenue from selling the good.…
A: At the marketplace, producer surplus refers to the addition gain to producers when they sell a…
Q: Refer to the graph provided. A price floor set at $5 will result in * Price $5 4 3 D 100 150 200…
A: The price floor is a lower limit on the price.
Q: PRICE (Dulars per pen 1 . QUANTITY (Mens of pens Supply 5. At a price of $2, quantity supplied is…
A: "Demand curve in economics depicts a positive relationship between the price and quantity demanded…
Q: a) Calculate consumer surplus and producer surplus at the equilibrium. b) Calculate the loss in…
A: Answer to the subparts of the question are as follows :
Q: 9) MARKET EQUILIBRIUM Suppose the demand for a product is given by p = d(q) = -0.4q + 300 and the…
A: Given information Demand equation: d(q)=-0.4q+300 Supply equation: s(q)=0.2q To find: equilibrium…
Q: Find the consumer surplus and producer surplus. Demand p= 100-0.00006x Supply p= 90+0.00004x
A: Consumers surplus is the difference between the maximum price a consumer is willing to pay and the…
Q: For a product the supply curve is p=5+.2q and the demand curve is p=20-.01q^2 p is price q is…
A: We are going to calculate equilibrium price, quantity and consumer surplus to answer this question.…
Q: QUESTION 7 Price N 02 M Demand Quantity Fer to the graph above that area) represents the producer…
A: Note:- Since we can only answer one question at a time, we'll answer the first one. Please repost…
Q: Price of Good X P3 2 a 0 Q₁ 22 Quantity of Good X Refer to Exhibit 4-C. If price P₁ is a price…
A: Price floor is the minimum price that a buyer is legally bound to pay. It is decided by the…
Q: Due to Government's step the new demand curve and price curve will revert back to its original state…
A: The graph below represents how the government's step the new demand curve and price curve will…
Q: Total surplus in this market is $ million.
A: Total Surplus = Consumer Surplus + Producer Surplus
Q: Efficiency loss refers to: O the situation where the maximum willingness to pay for a product is…
A: In demand supply model, the efficient point is the point where the maximum willingness to pay for a…
Q: 15 10 7.50 2.50 100 200 300 400 500 600 70 900 Quantity (hours of tutoring per week) 800 If the…
A: here we can calculate consumer surplus for the market in numerals
Q: If total surplus is $200 and consumer surplus is $90 Find producer surplus
A: The data presented in the question above is:- Total surplus = $200 Consumer surplus = $90 We need to…
Q: Suppose the following demand P=30-Q/25 and supply function: P=Q/20+15 Find…
A: Equilibrium is attained where the demand and the supply are in balance.
Q: Price/unit 4 P3 B P2 E iF P1 D Quantity/time In figure 2, the area of [A + B + C] represents A)…
A: Equilibrium price: Equilibrium is a state of no change. So, in the same way, the supply of goods…
Trending now
This is a popular solution!
Step by step
Solved in 2 steps
- Can you propose a policy that meld induce the market to supply more rental housing units?Select the correct answer. A price ceiling will usually shift: demand supply both neitherTotal surplus is maximized at the equilibriumprice and quantity. When demand increases,price increases. Explain how total surplus is stillmaximized if price increases due to an increase indemand
- e inverse supply function for pizza is: PS = 4 + QS The inverse demand function for pizza is: PD = 10 - QD The price paid by consumers after the government introduces a $2 tax on production is: (Hint: it would be a mistake to do 'Equilibrium Price + $2')A. Diagram 2- Which of the following area (A-C, select 1), represents the additional surplus fromthe original sellers as a results of priceincreasing from P1 to P2? B. Diagram 2- Which of the following area (A-C, select 1), represents the additional surplus fromthe new sellers as a results of priceincreasing from P1 to P2?At the equilibrium price, consumer surplus is a. $1,600. b. $800. c. $700. d. $1,400.
- Only typed answer Find the consumer surplus. Supply: Q=2P. Demand: Q=100-5P7) If the price of good X increases from RM3 to RM5, the quantity demanded drops from 10 to 8. Find the slope of the demand curve. a) 0.2b) 5c) -1d) -2Other: 8) Based on Question 7, calculate the quantity when the price is equal to 0.1 pointa) 13b) 2c) 10d) 5 9) Based on Question 7, if the market price is equal to 1, determine how many units of good X will be sold in the market. a) cannot be determinedb) 12c) 10d) 14 10) If the price of Pepsi increases, what will happen to the market price of Coke? a) remain unchangedb) decreasec) increased) changeSuppose the demand for French bread rises. Explain what happens to producer surplus inthe market for French bread. Explain what happens to producer surplus in the market forflour. Illustrate your answers with diagrams.It is a hot day, and Bert is thirsty. Here is the value he places on each bottle of water:Value of first bottle $7Value of second bottle $5Value of third bottle $3Value of fourth bottle $1a. From this information, derive Bert’s demand schedule. Graph his demand curve for bottledwater.b. If the price of a bottle of water is $4, how many bottles does Bert buy? How muchconsumer surplus does Bert get from his purchases? Show Bert’s consumer surplus in yourgraph.c. If the price falls to $2, how does quantity demanded change? How does Bert’s consumersurplus change? Show these changes in your graph.
- only typed answer A consumer has inverse demand of p=15−1q for a good and the market price is $4.00. Calculate consumer surplus and the total value of the good for the corresponding quantity consumed. Consumer surplus is $enter your response here. (Enter your response rounded to two decimal places.) The consumer's expenditure for the good is $enter your response here. (Enter your response rounded to two decimal places.)Equations of the demand and the suply curves:Qd=70-10PQs=-30+10P(a) Determine the equilibrium price and the quantity of good.(b) Draw the demand and supply curves.(c) Determine whether there is a surplus or a shortage at P= 4 and at P=6. Show them on the graph.a) In the market for sugary drinks, the current equilibrium price is $10 and the equilibrium quantity is 30. The demand choke price is $50 and the supply choke price is $5 (a) Draw a demand and supply diagram, and shade the regions that represent consumer and producer welfare. Calculate the Total welfare in this market b) In this market, you now know that E D = −0.4 and E S = 1.2. Redraw your diagram in part (a) with the correct sloping curves. In this part you do not have to shade the welfare regions. All you need to do is redraw the diagram with the same equilibrium price and quantity, and choke prices but adjust the slope of each curve to reflect their respective elasticity c) If a tax was to be implemented in this market, what percentage of the burden is borne by the buyer? d) The government plans to discourage the consumption of sugary drinks and as such, they implemented a $1 tax on every bottle produced. In this situation, the suppliers are taxed directly but they hope to pass…