Figure 8.1 shows the marginal pollution control costs per ton for a firm that would pollute at Qmax without any regulation. Suppose a pollution tax of T1 per ton were implemented, with the firm reducing pollution to Qtax. What area(s) would represent(s) the tax paid by the firm? Group of answer choices A B+C A+B A+B+C B
Figure 8.1 shows the marginal pollution control costs per ton for a firm that would pollute at Qmax without any regulation. Suppose a pollution tax of T1 per ton were implemented, with the firm reducing pollution to Qtax. What area(s) would represent(s) the tax paid by the firm? Group of answer choices A B+C A+B A+B+C B

Managerial Economics: Applications, Strategies and Tactics (MindTap Course List)
14th Edition
ISBN:9781305506381
Author:James R. McGuigan, R. Charles Moyer, Frederick H.deB. Harris
Publisher:James R. McGuigan, R. Charles Moyer, Frederick H.deB. Harris
Chapter10: Prices, Output, And Strategy: Pure And Monopolistic Competition
Section: Chapter Questions
Problem 1.1CE

Related questions
Question
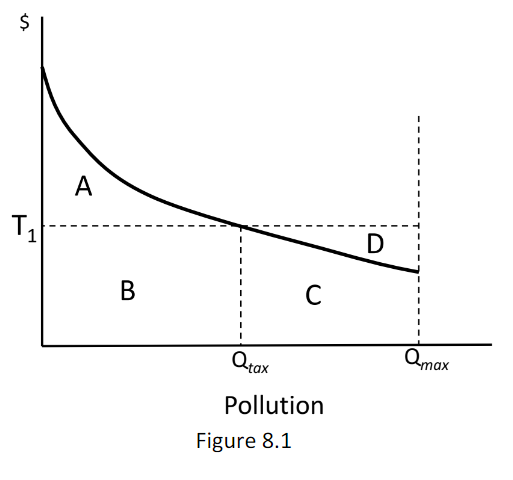
Figure 8.1 shows the marginal pollution control costs per ton for a firm that would pollute at Qmax without any regulation. Suppose a pollution tax of T1 per ton were implemented, with the firm reducing pollution to Qtax. What area(s) would represent(s) the tax paid by the firm?
Group of answer choices
A
B+C
A+B
A+B+C
B
Transcribed Image Text:$
es
T₁ 1
A
B
C
Qtax
Pollution
Figure 8.1
D
Qmax
Expert Solution
This question has been solved!
Explore an expertly crafted, step-by-step solution for a thorough understanding of key concepts.

This is a popular solution!

Trending now
This is a popular solution!

Step by step
Solved in 2 steps

Knowledge Booster


Learn more about
Need a deep-dive on the concept behind this application? Look no further. Learn more about this topic, economics and related others by exploring similar questions and additional content below.Recommended textbooks for you
Managerial Economics: Applications, Strategies an…
Economics
ISBN:
9781305506381
Author:
James R. McGuigan, R. Charles Moyer, Frederick H.deB. Harris
Publisher:
Cengage Learning
Managerial Economics: Applications, Strategies an…
Economics
ISBN:
9781305506381
Author:
James R. McGuigan, R. Charles Moyer, Frederick H.deB. Harris
Publisher:
Cengage Learning