Figure: Market for Hamburgers Price of hamburger $5.00 4.50 4.00 3.50 3.00 2.50 S1 2.00 1.50 1.00 0.50 D1 100 200 300 400 500 600 700 800 Quantity of hamburgers (per week) Reference: Ref 4-9 (Figure: The Market for Hamburgers) The figure The Market for Hamburgers shows the weekly market for hamburgers in Irvine, Kentucky. If 400 hamburgers are sold, producer sırplus will equal: O $510. $200.
Figure: Market for Hamburgers Price of hamburger $5.00 4.50 4.00 3.50 3.00 2.50 S1 2.00 1.50 1.00 0.50 D1 100 200 300 400 500 600 700 800 Quantity of hamburgers (per week) Reference: Ref 4-9 (Figure: The Market for Hamburgers) The figure The Market for Hamburgers shows the weekly market for hamburgers in Irvine, Kentucky. If 400 hamburgers are sold, producer sırplus will equal: O $510. $200.

Chapter4: Demand, Supply, And Markets
Section: Chapter Questions
Problem 1.2P

Related questions
Question
2..8
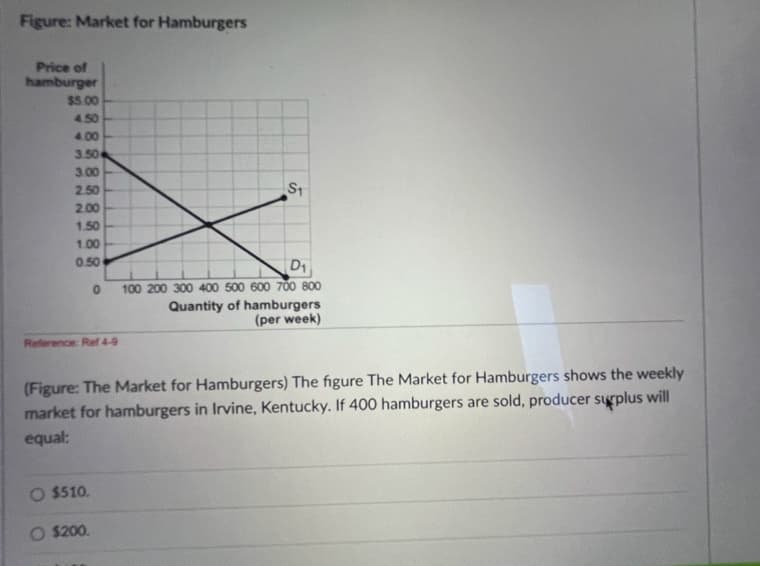
Transcribed Image Text:Figure: Market for Hamburgers
Price of
hamburger
$5.00
450
4.00
3.50
3.00
2.50
St
2.00
1.50
1.00
0.50
D1
100 200 300 400 500 600 700 800
Quantity of hamburgers
(per week)
Reference: Ref 4-9
(Figure: The Market for Hamburgers) The figure The Market for Hamburgers shows the weekly
market for hamburgers in Irvine, Kentucky. If 400 hamburgers are sold, producer surplus will
equal:
O $510.
O $200.
Expert Solution
This question has been solved!
Explore an expertly crafted, step-by-step solution for a thorough understanding of key concepts.

This is a popular solution!

Trending now
This is a popular solution!

Step by step
Solved in 3 steps

Recommended textbooks for you


Economics (MindTap Course List)
Economics
ISBN:
9781337617383
Author:
Roger A. Arnold
Publisher:
Cengage Learning
Economics (MindTap Course List)
Economics
ISBN:
9781337617383
Author:
Roger A. Arnold
Publisher:
Cengage Learning

Essentials of Economics (MindTap Course List)
Economics
ISBN:
9781337091992
Author:
N. Gregory Mankiw
Publisher:
Cengage Learning

Principles of Economics 2e
Economics
ISBN:
9781947172364
Author:
Steven A. Greenlaw; David Shapiro
Publisher:
OpenStax