The market for wool in the economy of Odessa is shown in the table below (note that quantities are given in tonnes per year). Price (5) 200 see 7ee Quantity denanded Quantity denanded 2 Quantity supplied Quantity supplied 2 16e 14e 12e 1ee se 190 170 150 130 110 90 1e 30 30 se 75 105 15 45 60 90 a. Plot the demand and supply curves. Di and St in the graphing area below. Also mark the equilibrium, E1. in the graph. Choose the appropriate tool and piot only the two endpoints for every line or curve drawn in the graph below. Remember to also plot the equilibrium using the tool E Market for Wool in Odessa 800 Tools 700 600 500 S 400 300 200 100 20 40 60 80 100 120 140 160 180 200 Quantity of wool (tonnes per year) Price
The market for wool in the economy of Odessa is shown in the table below (note that quantities are given in tonnes per year). Price (5) 200 see 7ee Quantity denanded Quantity denanded 2 Quantity supplied Quantity supplied 2 16e 14e 12e 1ee se 190 170 150 130 110 90 1e 30 30 se 75 105 15 45 60 90 a. Plot the demand and supply curves. Di and St in the graphing area below. Also mark the equilibrium, E1. in the graph. Choose the appropriate tool and piot only the two endpoints for every line or curve drawn in the graph below. Remember to also plot the equilibrium using the tool E Market for Wool in Odessa 800 Tools 700 600 500 S 400 300 200 100 20 40 60 80 100 120 140 160 180 200 Quantity of wool (tonnes per year) Price

Chapter1: Introducing The Economic Way Of Thinking
Section1.A: Applying Graphs To Economics
Problem 2SQP

Related questions
Question
Please help with creating the graph
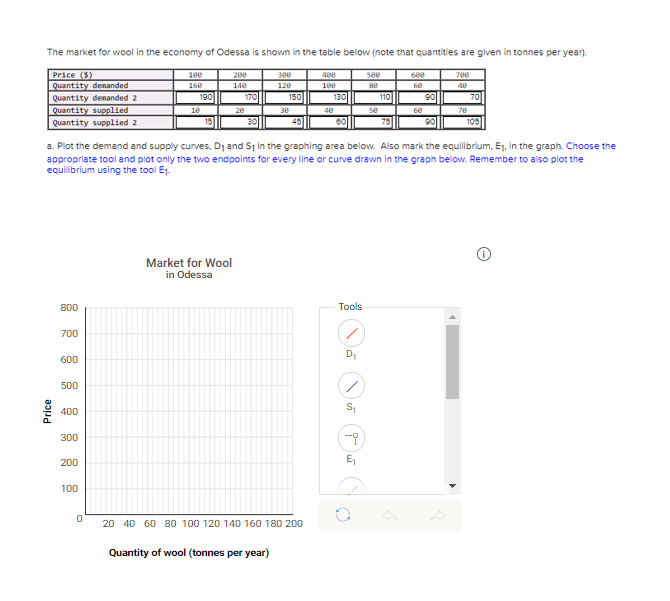
Transcribed Image Text:The market for wool in the economy of Odessa is shown in the table below (note that quantities are given in tonnes per year).
Price (5)
Quantity denanded
100
200
300
400
500
600
700
160
140
120
180
se
60
190
170
150
130
110
90
70
Quantity denanded 2
Quantity supplied
Quantity supplied 2
10
20
30
se
6e
70
15
30
45
60
75
105
a. Plot the demand and supply curves, D1 and Sj in the graphing area below. Also mark the equilibrium, Ej. in the graph. Choose the
appropriate tool and plot only the two endpoints for every line or curve drawn in the graph below. Remember to also plot the
equilibrium using the tool E1.
Market for Wool
in Odessa
800
Tools
700
600
500
400
300
200
E,
100
20 40 60 80 100 120 140 160 180 200
Quantity of wool (tonnes per year)
Price
Expert Solution
This question has been solved!
Explore an expertly crafted, step-by-step solution for a thorough understanding of key concepts.

This is a popular solution!

Trending now
This is a popular solution!

Step by step
Solved in 2 steps with 1 images

Knowledge Booster


Learn more about
Need a deep-dive on the concept behind this application? Look no further. Learn more about this topic, economics and related others by exploring similar questions and additional content below.Recommended textbooks for you


Managerial Economics: Applications, Strategies an…
Economics
ISBN:
9781305506381
Author:
James R. McGuigan, R. Charles Moyer, Frederick H.deB. Harris
Publisher:
Cengage Learning

Exploring Economics
Economics
ISBN:
9781544336329
Author:
Robert L. Sexton
Publisher:
SAGE Publications, Inc