Fill in the remaining cells of the following table. Average Variable Cost (Dollars per pair) Average Total Cost (Dollars per pair) Variable Cost Marginal Cost (Dollars) Quantity Total Cost Fixed Cost (Pairs) (Dollars) (Dollars) (Dollars) 120 1. 200 240 285 4 340 425 6 540
Fill in the remaining cells of the following table. Average Variable Cost (Dollars per pair) Average Total Cost (Dollars per pair) Variable Cost Marginal Cost (Dollars) Quantity Total Cost Fixed Cost (Pairs) (Dollars) (Dollars) (Dollars) 120 1. 200 240 285 4 340 425 6 540

Chapter6: Proudction Costs
Section: Chapter Questions
Problem 8SQP

Related questions
Question
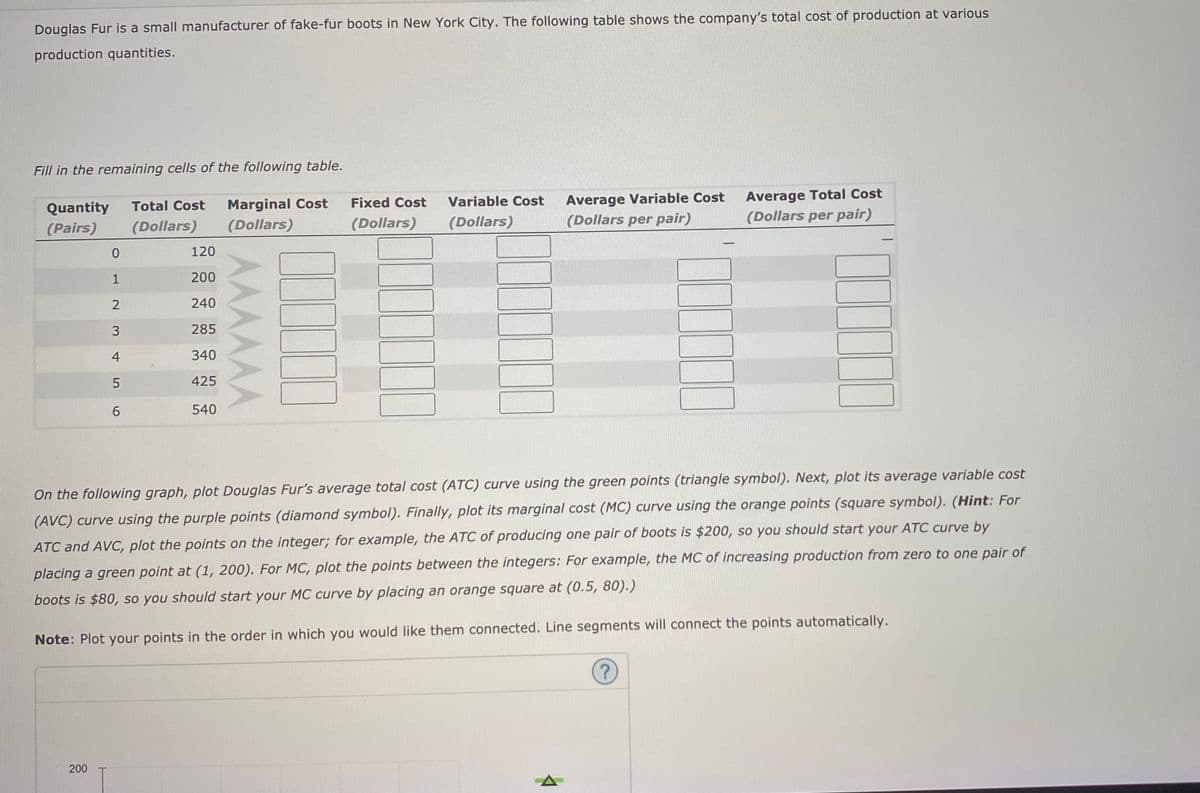
Transcribed Image Text:Douglas Fur is a small manufacturer of fake-fur boots in New York City. The following table shows the company's total cost of production at various
production quantities.
Fill in the remaining cells of the following table.
Variable Cost
Average Variable Cost
Average Total Cost
Quantity
Total Cost
Marginal Cost
Fixed Cost
(Dollars)
(Dollars)
(Dollars)
(Dollars per pair)
(Dollars per pair)
(Pairs)
(Dollars)
120
1
200
240
285
4
340
425
540
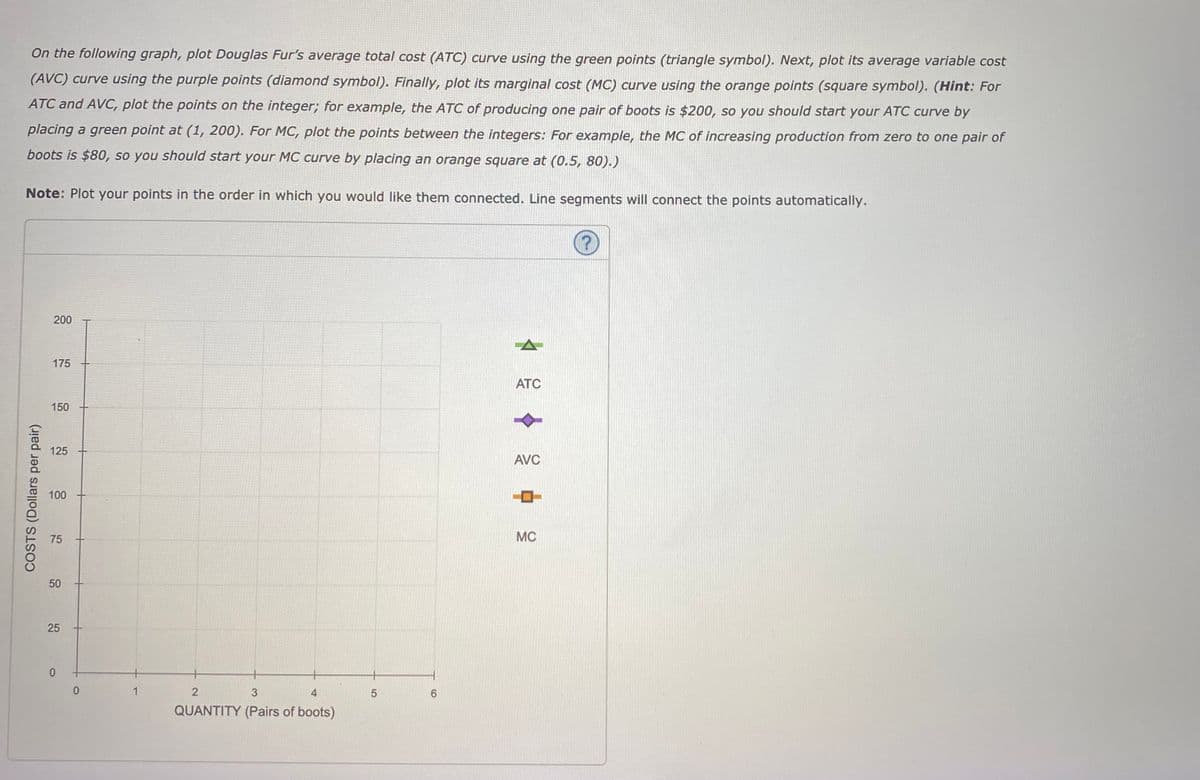
On the following graph, plot Douglas Fur's average total cost (ATC) curve using the green points (triangle symbol). Next, plot its average variable cost
(AVC) curve using the purple points (diamond symbol). Finally, plot its marginal cost (MC) curve using the orange points (square symbol). (Hint: For
ATC and AVC, plot the points on the integer; for example, the ATC of producing one pair of boots is $200, so you should start your ATC curve by
placing a green point at (1, 200). For MC, plot the points between the integers: For example, the MC of increasing production from zero to one pair of
boots is $80, so you should start your MC curve by placing an orange square at (0.5, 80).)
Note: Plot your points in the order in which you would like them connected. Line segments will connect the points automatically.
?.
200
Transcribed Image Text:On the following graph, plot Douglas Fur's average total cost (ATC) curve using the green points (triangle symbol). Next, plot its average variable cost
(AVC) curve using the purple points (diamond symbol). Finally, plot its marginal cost (MC) curve using the orange points (square symbol). (Hint: For
ATC and AVC, plot the points on the integer; for example, the ATC of producing one pair of boots is $200, so you should start your ATC curve by
placing a green point at (1, 200). For MC, plot the points between the integers: For example, the MC of increasing production from zero to one pair of
boots is $80, so you should start your MC curve by placing an orange square at (0.5, 80).)
Note: Plot your points in the order in which you would like them connected. Line segments will connect the points automatically.
200
175
ATC
150
125
AVC
100
MC
50
25
6.
QUANTITY (Pairs of boots)
COSTS (Dollars per pair)
Expert Solution
Step 1
The quantity represents the levels of output that a producer produces.
Total cost is the sum total of fixed cost and variable cost.

Trending now
This is a popular solution!

Step by step
Solved in 7 steps with 2 images

Knowledge Booster


Learn more about
Need a deep-dive on the concept behind this application? Look no further. Learn more about this topic, economics and related others by exploring similar questions and additional content below.Recommended textbooks for you


Managerial Economics: A Problem Solving Approach
Economics
ISBN:
9781337106665
Author:
Luke M. Froeb, Brian T. McCann, Michael R. Ward, Mike Shor
Publisher:
Cengage Learning
Managerial Economics: A Problem Solving Approach
Economics
ISBN:
9781337106665
Author:
Luke M. Froeb, Brian T. McCann, Michael R. Ward, Mike Shor
Publisher:
Cengage Learning


Managerial Economics: Applications, Strategies an…
Economics
ISBN:
9781305506381
Author:
James R. McGuigan, R. Charles Moyer, Frederick H.deB. Harris
Publisher:
Cengage Learning

Economics (MindTap Course List)
Economics
ISBN:
9781337617383
Author:
Roger A. Arnold
Publisher:
Cengage Learning