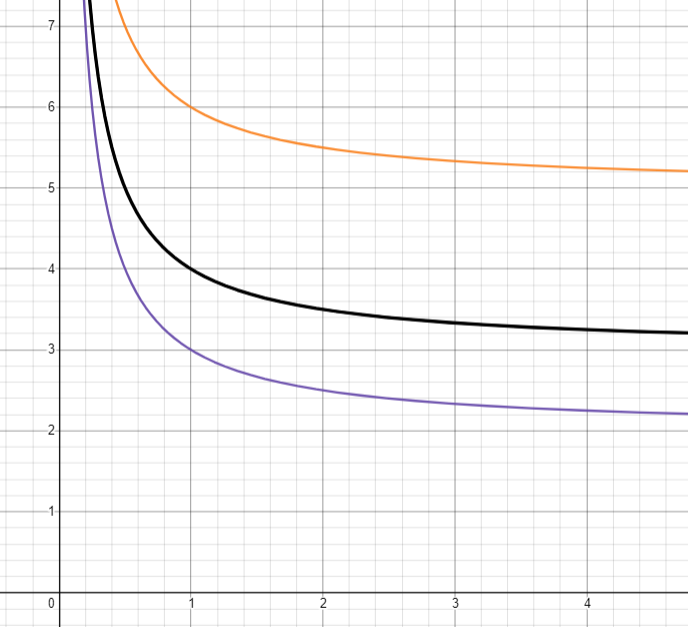
Plot and label 3 indifference curves for each of three consumers, using a different graph for each consumer: U(x1,X2) = X,X2 is consumer 1 so draw three curves for them U(x1,X2) = min(x,/5, 2x,+3) is consumer 2, so 3 curves for them U(x1,X2) = 3x, + 4x, is consumer 3, so 3 curves for them too On each consumer's graph, plot and label the budget constraint that uses Y = 100, px1 = $4, px2 = $5 > Now assume that there is a tax of $1 per unit of x1, to be refunded as payment of $10 per person. Plot that new post-tax budget constraint on each consumer's graph. > As best you can, find consumer equilibrium for each consumer in the pre-tax and post-tax situations (6 solutions in all) > What is the value of MRS at each of the 6 equilibria?
Plot and label 3 indifference curves for each of three consumers, using a different graph for each consumer: U(x1,X2) = X,X2 is consumer 1 so draw three curves for them U(x1,X2) = min(x,/5, 2x,+3) is consumer 2, so 3 curves for them U(x1,X2) = 3x, + 4x, is consumer 3, so 3 curves for them too On each consumer's graph, plot and label the budget constraint that uses Y = 100, px1 = $4, px2 = $5 > Now assume that there is a tax of $1 per unit of x1, to be refunded as payment of $10 per person. Plot that new post-tax budget constraint on each consumer's graph. > As best you can, find consumer equilibrium for each consumer in the pre-tax and post-tax situations (6 solutions in all) > What is the value of MRS at each of the 6 equilibria?

Chapter6: Consumer Choice Theory
Section6.A: Indifference Curve Analysis
Problem 11SQ

Related questions
Question
Really need some help answering these questions, it’s all one problem but I understand that it’s kind of big. You can take away a couple of my “questions left” if you need. I just need help understanding as much of this as possible. Anything helps. Thank you so much.
Transcribed Image Text:Plot and label 3 indifference curves for each of three
consumers, using a different graph for each consumer:
U(x1,X2) = X,X2 is consumer 1 so draw three curves for them
U(x1,X2) = min(x,/5, 2x,+3) is consumer 2, so 3 curves for them
U(x1,X2) = 3x, + 4x, is consumer 3, so 3 curves for them too
On each consumer's graph, plot and label the budget
constraint that uses Y = 100, px1 = $4, px2 = $5
> Now assume that there is a tax of $1 per unit of x1, to be
refunded as payment of $10 per person. Plot that new
post-tax budget constraint on each consumer's graph.
> As best you can, find consumer equilibrium for each
consumer in the pre-tax and post-tax situations (6
solutions in all)
> What is the value of MRS at each of the 6 equilibria?
Expert Solution
Step 1
Solution:
Consumer 1:

Step by step
Solved in 6 steps with 5 images

Knowledge Booster


Learn more about
Need a deep-dive on the concept behind this application? Look no further. Learn more about this topic, economics and related others by exploring similar questions and additional content below.Recommended textbooks for you


Economics (MindTap Course List)
Economics
ISBN:
9781337617383
Author:
Roger A. Arnold
Publisher:
Cengage Learning
Economics (MindTap Course List)
Economics
ISBN:
9781337617383
Author:
Roger A. Arnold
Publisher:
Cengage Learning
