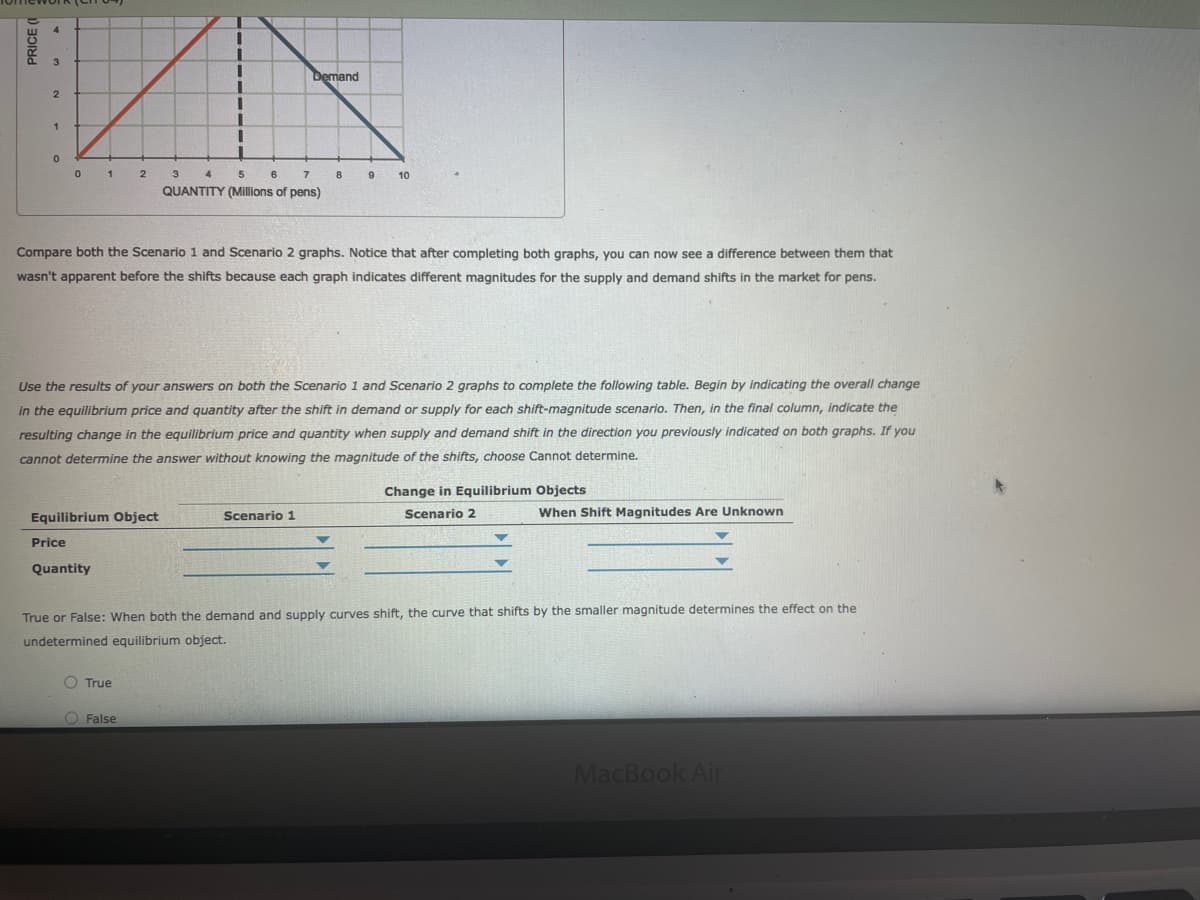
Compare both the Scenario 1 and Scenario 2 graphs. Notice that after completing both graphs, you can now see a difference between them that wasn't apparent before the shifts because each graph indicates different magnitudes for the supply and demand shifts in the market for pens. Use the results of your answers on both the Scenario 1 and Scenario 2 graphs to complete the following table. Begin by indicating the overall change in the equilibrium price and quantity after the shift in demand or supply for each shift-magnitude scenario. Then, in the final column, indicate the resulting change in the equilibrium price and quantity when supply and demand shift in the direction you previously indicated on both graphs. If you cannot determine the answer without knowing the magnitude of the shifts, choose Cannot determine. Change in Equilibrium Objects Scenario 2 Equilibrium Object Scenario 1 When Shift Magnitudes Are Unknown Price Quantity True or False: When both the demand and supply curves shift, the curve that shifts by the smaller magnitude determines the effect on the undetermined equilibrium object. O True O False


Answer:
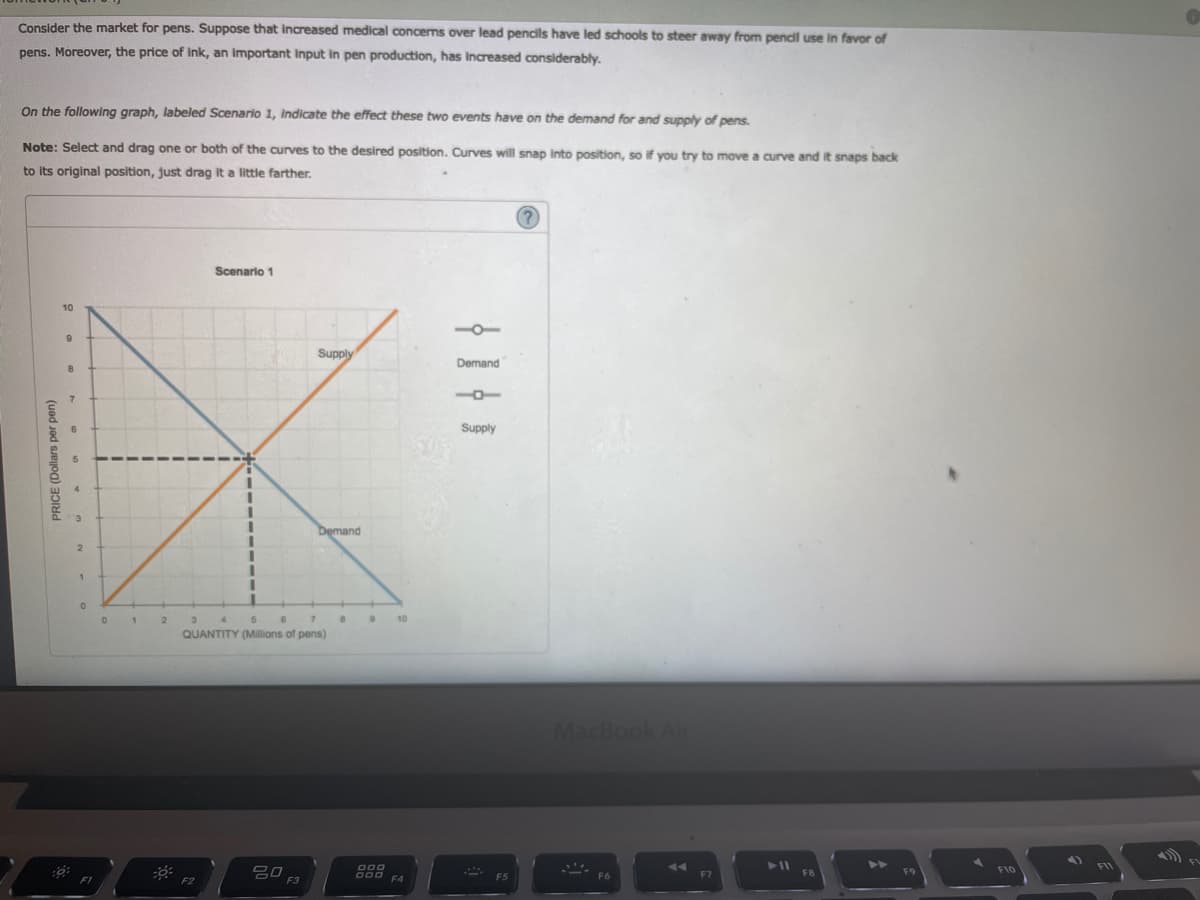
If the medical concern over lead pencils increases causing the increased demand for pens then the demand curve of pens will shift to the right.
If the price of ink (input) increases then the cost of production will increase and the firms will decrease supply. As a result, the supply curve will shift to the left.
Scenario 1: the shift in demand is greater than the shift in supply (shift in demand>shift in supply)
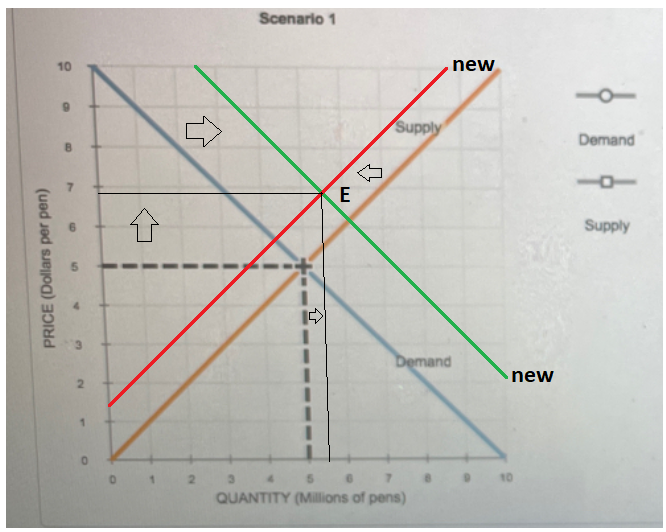
According to the above figure, when the demand curve shifts by a greater amount the price increases, and the equilibrium quantity also increase.
Scenario 2: the shift in the supply curve is greater than the shift in the demand curve (shift in supply>shift in demand)
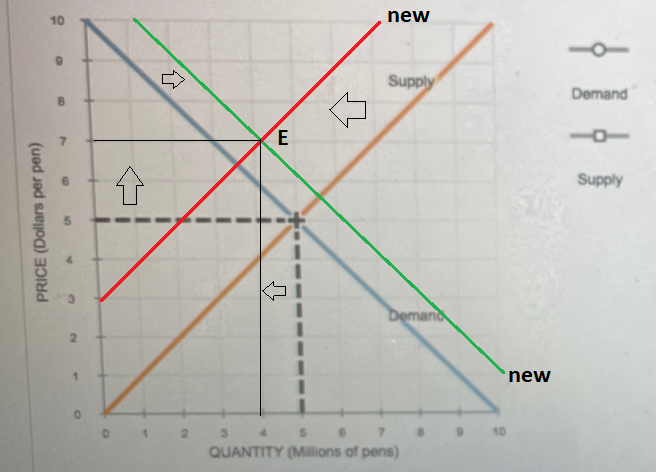
According to the above figure, when the supply curve shifts by a greater amount the price increases, and the equilibrium quantity decreases.

Trending now
This is a popular solution!

Step by step
Solved in 2 steps with 3 images


