The following data are available for XYZ Corporation for years 2014 and 2013. XYZ Corporation Statement of Financial Position As of December 31 Change Peso % 2013 2014 Assets 2,000 26,800 Cash and equivalents Receivables Inventories 14,000 28,800 54,000 4,800 101,600 16,000 55,600 85,600 7,400 164,600 93.06% ? Prepayments and others Total Current Assets 2,600 54.17% 62.01% Property, Plant & Equipment - net of depreciation Total Assets. 73,400 238.000 43,200 143.05% 30,200 131,800 Liabilities and Equity Notes payable to banks Accounts payable Accrued liabilities Income taxes payable Total current liabilities 54,000 55,400 6,800 7,000 123,200 44,600 70,200 114,800 238.000 44,000 23,800 2,600 440.00% 10,000 31,600 4,200 5,800 51,600 44,600 35,600 80,200 131,800 ? 61.90% ? 0.00% Share capital Retained earnings Total equity Total liabilities and equity 34,600 34,600 ? 43.14%
The following data are available for XYZ Corporation for years 2014 and 2013. XYZ Corporation Statement of Financial Position As of December 31 Change Peso % 2013 2014 Assets 2,000 26,800 Cash and equivalents Receivables Inventories 14,000 28,800 54,000 4,800 101,600 16,000 55,600 85,600 7,400 164,600 93.06% ? Prepayments and others Total Current Assets 2,600 54.17% 62.01% Property, Plant & Equipment - net of depreciation Total Assets. 73,400 238.000 43,200 143.05% 30,200 131,800 Liabilities and Equity Notes payable to banks Accounts payable Accrued liabilities Income taxes payable Total current liabilities 54,000 55,400 6,800 7,000 123,200 44,600 70,200 114,800 238.000 44,000 23,800 2,600 440.00% 10,000 31,600 4,200 5,800 51,600 44,600 35,600 80,200 131,800 ? 61.90% ? 0.00% Share capital Retained earnings Total equity Total liabilities and equity 34,600 34,600 ? 43.14%

Financial Accounting
14th Edition
ISBN:9781305088436
Author:Carl Warren, Jim Reeve, Jonathan Duchac
Publisher:Carl Warren, Jim Reeve, Jonathan Duchac
Chapter17: Financial Statement Analysis
Section: Chapter Questions
Problem 17E

Related questions
Question
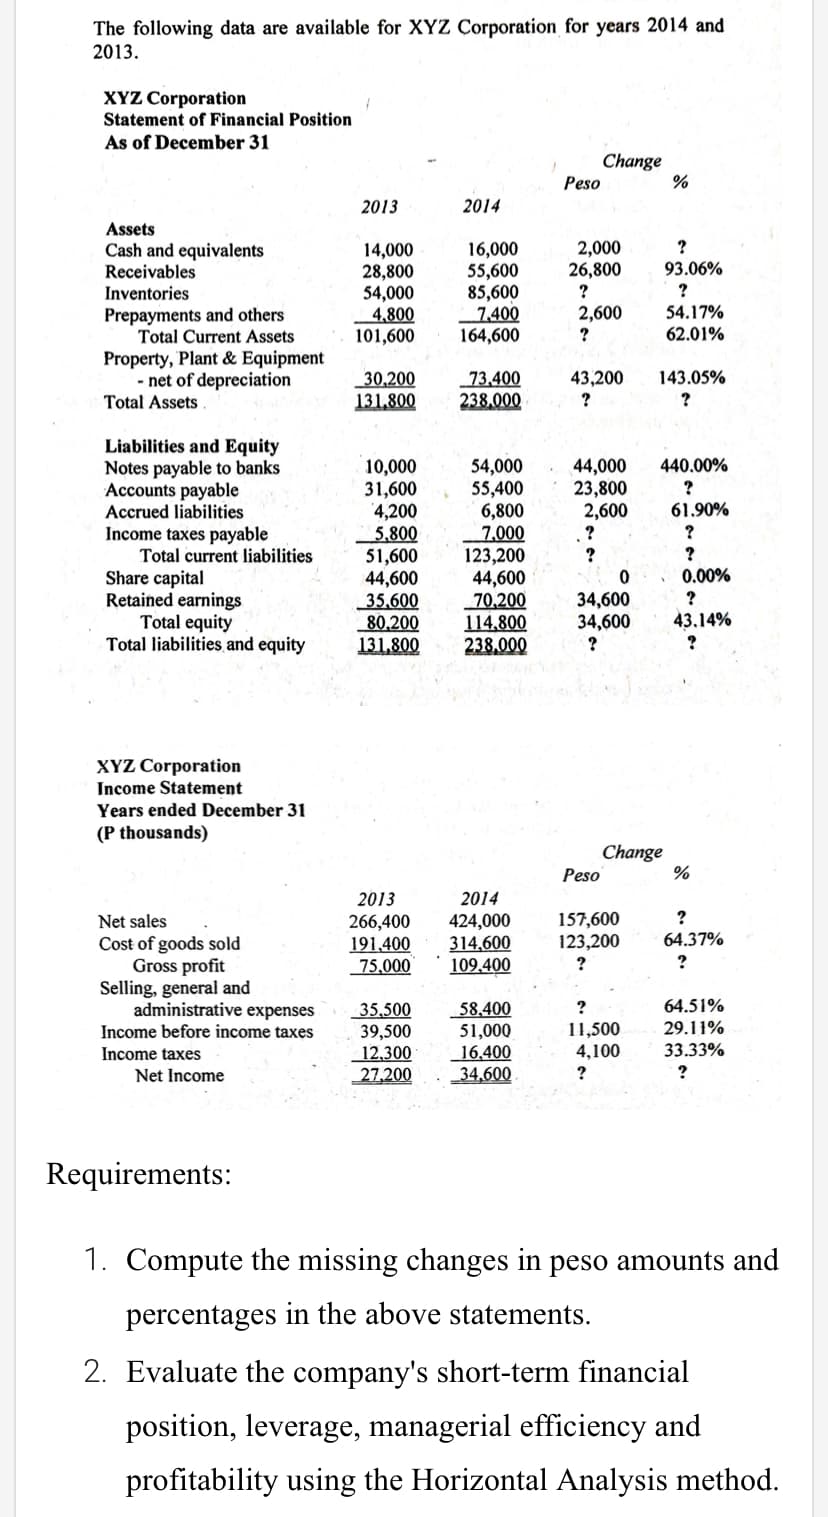
Transcribed Image Text:The following data are available for XYZ Corporation for years 2014 and
2013.
XYZ Corporation
Statement of Financial Position
As of December 31
Change
Peso
%
2013
2014
Assets
Cash and equivalents
Receivables
Inventories
Prepayments and others
Total Current Assets
14,000
28,800
54,000
4,800
101,600
16,000
55,600
85,600
_7,400
164,600
2,000
26,800
?
93.06%
?
2,600
54.17%
62.01%
Property, Plant & Equipment
- net of depreciation
Total Assets
43,200
73,400
238,000
143.05%
30,200
131.800
Liabilities and Equity
Notes payable to banks
Accounts payable
Accrued liabilities
Income taxes payable
Total current liabilities
Share capital
Retained earnings
Total equity
Total liabilities and equity
10,000
31,600
4,200
_ 5,800
51,600
44,600
35.600
80,200
131,800
54,000
55,400
6,800
7,000
123,200
44,600
70,200
44,000
23,800
2,600
.?
?
440.00%
61.90%
0.00%
34,600
34,600
43,14%
114,800
238.000
XYZ Corporation
Income Statement
Years ended December 31
(P thousands)
Change
Peso
2013
2014
266,400
191,400
75,000
424,000
314,600
109.400
157,600
123,200
Net sales
64.37%
Cost of goods sold
Gross profit
Selling, general and
administrative expenses
Income before income taxes
?
?
64.51%
35,500
39,500
12,300
27,200
58.400
51,000
_16,400
_34,600
11,500
4,100
29.11%
Income taxes
33.33%
Net Income
?
?
Requirements:
1. Compute the missing changes in peso amounts and
percentages in the above statements.
2.
Evaluate the company's short-term financial
position, leverage, managerial efficiency and
profitability using the Horizontal Analysis method.
Expert Solution
This question has been solved!
Explore an expertly crafted, step-by-step solution for a thorough understanding of key concepts.

This is a popular solution!

Trending now
This is a popular solution!

Step by step
Solved in 4 steps with 3 images

Knowledge Booster


Learn more about
Need a deep-dive on the concept behind this application? Look no further. Learn more about this topic, accounting and related others by exploring similar questions and additional content below.Recommended textbooks for you
Financial Accounting
Accounting
ISBN:
9781305088436
Author:
Carl Warren, Jim Reeve, Jonathan Duchac
Publisher:
Cengage Learning
Financial Accounting
Accounting
ISBN:
9781305088436
Author:
Carl Warren, Jim Reeve, Jonathan Duchac
Publisher:
Cengage Learning