Find a 95% confidence interval on the difference in mean life. Find the following: a. Pooled Variance ,b. Margin of Error c. Upper Mean and d. Lower Mean
Find a 95% confidence interval on the difference in mean life. Find the following: a. Pooled Variance ,b. Margin of Error c. Upper Mean and d. Lower Mean

Glencoe Algebra 1, Student Edition, 9780079039897, 0079039898, 2018
18th Edition
ISBN:9780079039897
Author:Carter
Publisher:Carter
Chapter10: Statistics
Section10.4: Distributions Of Data
Problem 19PFA

Related questions
Question
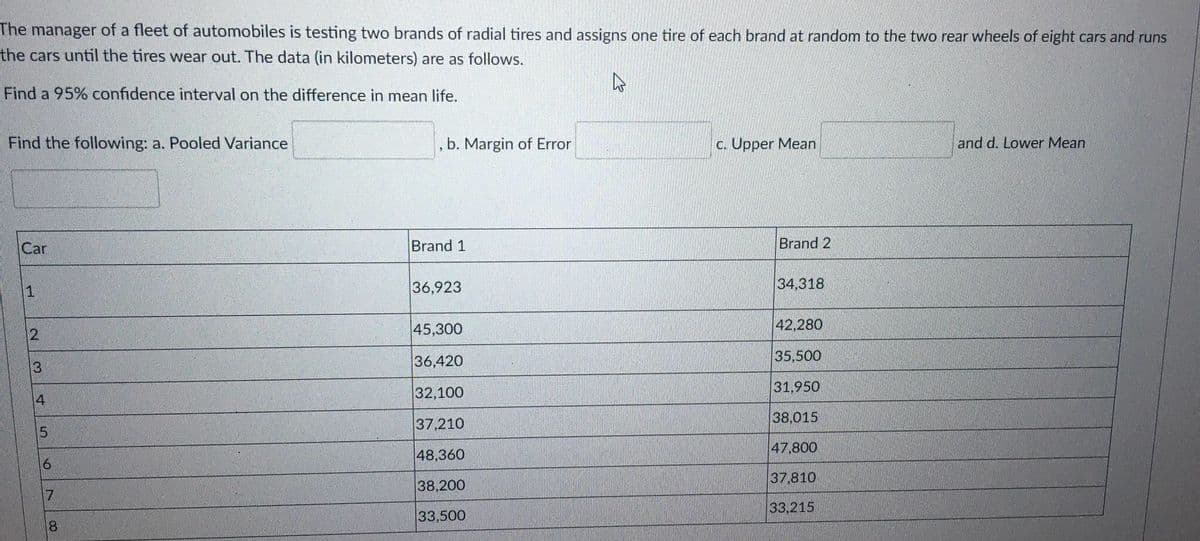
Transcribed Image Text:The manager of a fleet of automobiles is testing two brands of radial tires and assigns one tire of each brand at random to the two rear wheels of eight cars and runs
the cars until the tires wear out. The data (in kilometers) are as follows.
Find a 95% confidence interval on the difference in mean life.
Find the following: a. Pooled Variance
, b. Margin of Error
c. Upper Mean
and d. Lower Mean
Car
Brand 1
Brand 2
1.
36,923
34,318
12.
45,300
42,280
36,420
35,500
3
31,950
4
32,100
37,210
38,015
47,800
48,360
37.810
38,200
33,215
33,500
8
Expert Solution
This question has been solved!
Explore an expertly crafted, step-by-step solution for a thorough understanding of key concepts.

Step by step
Solved in 2 steps with 2 images

Recommended textbooks for you
Glencoe Algebra 1, Student Edition, 9780079039897…
Algebra
ISBN:
9780079039897
Author:
Carter
Publisher:
McGraw Hill
Glencoe Algebra 1, Student Edition, 9780079039897…
Algebra
ISBN:
9780079039897
Author:
Carter
Publisher:
McGraw Hill