

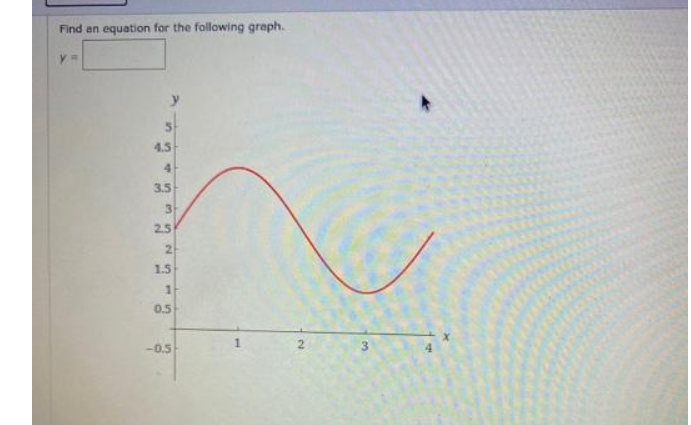
Q: Find an equation for the following graph. -1- -2 - 3/2
A:
Q: Graph the following equation S = 25N
A:
Q: Find the slope of the graph below. undefined O m = 2 m = -2 O m = 0
A: The correct option is the last option. The graph is represented by the blue line. The blue line is…
Q: Graph the following equation S = N/25
A:
Q: List the answers about the given graph. 13) 0 12 21
A:
Q: Graph the following equation on the graph S = 25N
A: topic - graph of a equation
Q: Use the graph shown to answer the next 7 questions. 10, 10 10
A: By the definition we know that local minima is the point where the graph changes from decreasing to…
Q: What kind of relationship is depicted in the following graph? Question options: a.…
A: From the given graph, the point between X and Y axis, lies in straight and positive direction.
Q: Graph the following equation N = 25S
A: We have to find out
Q: graph the following curve in two pieces
A:
Q: Which of the following graphs represents y = -x²? -10 -2 0 -2 6 10 විය. 24 6 09 2 8 10
A:
Q: Create an equation that matches the graph below. Use 'd' for dollars and 'r' for rabbits in your…
A:
Q: Describe one similarity and one difference between the graphs of 5 x? y? (x – 1 (v – 1 1. + = 1 and…
A: From the given data:
Q: Graph the following equation C = 175s + 4450
A:
Q: Graph the following equations. Label your graphs with the letter. a) y=-4x + 2 10 -86 2. -4-2 -2 4 6…
A: We know that, a line in slope- intercept form can be written as y=mx+c Here, m is the slope of line…
Q: Draw the graphs of the following lines: a 5x + 3y = 10 b 4
A: a. 5x+3y=10 let us find co-ordinates to draw graph assume x=0 then y=10/3=3.33 (0,3.33) assume…
Q: Click the following graph which represents the equation y = -,x? 3
A: Indentify any two random points on the graph with the help of given equation and draw a line passing…
Q: 4.75
A: Hello. Since your question has multiple parts, we will solve first question for you. If you want…
Q: 18 16 14 12 10 -6 -4
A:
Q: Graph the following: (1/((x-2)^2)) + 10
A: Given,
Q: Find an equation of the following graph
A: The graph in the above function is similar to a tan graphLet the function be in general…
Q: 2² + y? – 2? = 0
A: see below the graph of the equation given in the question
Q: John has savings of $6. He plans to save $2 every week from his weekly allowance for the next 4…
A: Given , John has savings of $6. He plans to save $2 every week from his weekly allowance for the…
Q: Graph the following equation W = 500 + 30T
A: Topic:- linear function
Q: Determine the equation of the midline of the following graph. 4 1 27 3. -1 3 3 -2 -3 -4 -5 3. 2. F10
A: Midline= Line + Middle
Q: graph 10 5 0 answer 5
A: Given: The graph of a function mx To find the following: d) Identify the x value for which mx=8. e)…
Q: Use the graph to answer the following questions.
A: Consider the given graph as,
Q: 4 3 -10 -9 -8 -5 -4 -3 -2 5 6 10 00 7. 3. 2. 1. 7.
A:
Q: Find the slope of the graph below: 400 300 200 100 a 50 100 -100 2.
A: We take two points on the curve. x1,y1=4,200x2,y2=6,300
Q: Use the graph shown to answer the next 7 questions. 10, ... .. . ..p... ............. 10 ..... 10
A: A graph
Q: Identify the equation represented by the following graph. 10 6 4 2 -9 -6 9. -2 -4 -6 -8 10 6. 3.
A: We have to find
Q: Graph the following explanation on the graph S = 25N
A:
Q: The following graph shows the point 5m 2, 4
A: Given: Standard cocentric circle with x2+y2=r2where r=1,2,3,4,and 5 and the given point situvated on…
Q: y= 4-x|
A: Here we can graph the given 'y' value as below.
Q: Determine the equation of the midline of the following graph. 3 -3T -37 -37 37 31 зл 15л 21A 27л 15л…
A: Midline is a horizontal line which is in middle of the function i.e., half of the function is above…
Q: Use the graph shown to answer the next 7 questions 10, .. ... ... : : : : ... -10
A: As part of exploring how functions change, we can identify intervals over which the function is…
Q: 22. y=-1 = -1
A:
Q: Which of the following graphs represents the relationship betweer x and y if y always increases as x…
A:
Q: Find an equation for the following graph. 97 12 3
A: We need to identify the function from the given curve. Here we can see that it is of the form of…
Q: Write the equation for the graph below. 5 -4 -3 -2 -1 4
A: The line in the graph passing through the points 0, -2 & 1, 0.
Q: Please read the following prompt, analyze the following graph, and complete questions 8.a and 8.b
A: Response bias arises when individuals in a survey provides inaccurate, wrong or false answers to a…
Q: Find the equation of the graph given below. When entering x in your answer, use the letter x rather…
A: Find the equation of the graph given below We will solve this step by step.
Q: Graph the following equation W = 35T + 700
A:
Q: What relationship does the graph represent? 4 A. Strong Negative 3.5 B. Strong Positive 3 C. Weak…
A: Correlations are used to measure the strength of association between the two numerical variable.…
Q: Find the equation that fits the graph shown. 10 2 -10 -2 2 10 -2 -4 10
A:
Q: 0.5 0.5 1.5 2 2.5 3.5 4 B
A: For h(x)=gx2 the input of the graph of g(x) will be multiplied by 2. or you can say the graph will…
Q: Find the slope of the following graph and write your result in the empty box. 10 8. 7. 5. 0 1 2 5 6…
A:
Q: 2. Write the equation given the graph below: 8 (1,8) wwww. 6- 4 (2,4) 0. 4. 8. www 6.
A: Find the equation
Q: Determine the equation of the midline of the following graph. 4 1 -5T 157 4. 57 4. 4. -1 2 -3 -4 -5…
A: the given graph is: we have to determine the equation of the midline of the given graph.

Step by step
Solved in 2 steps


- Graph the following explanation on the graph S = 25NJohn has savings of $6. He plans to save $2 every week from his weekly allowance for the next 4 weeks. Does the graph show the relationship between number of weeks from now and the money saved by John per week. Please look at the image belowSolve and select one of the graphs below. Thank you!
- Graph the following equation S = N/25Graph the following: (1/((x-2)^2)) + 101. The graph below shows the relationship between the distance biked and the time spent biking for two different bikers in a road race. Which of the following accurately compares the speed of the two bikers? a. Biker A is going faster than Biker B by 5 miles per hour. b. Biker A is going slower than Biker B by 5 miles per hour. c. Biker A is going faster than Biker B by 10 miles per hour. d. Biker A is going slower than Biker B by 10 miles per hour. 2. The graphs below show the distance two cars have traveled along the freeway over a period of several seconds. Car A is traveling 30 meters per second. Which equation from those shown below is the best choice for describing the distance traveled by car B after x seconds? Explain a. y = 85x b. y = 60x c. y = 30x d. y = 15x
- Graph the following equations and show all your workThe accompanying histogram shows the number of calories in a sample of fast-food items. Complete parts (a) through (c). Q. 1 Would this graph be best described as unimodal or bimodal? Q.2 Approximately what percentage of the fast-food items contained fewer than 300 calories? (Round to the nearest whole number as needed) Approximately ____% of the fast-food items contained fewer than 300 calories.Use the graph to the right to answer the following question. Which of the following is not true according to the graph? A) Taxpayers in the top 1% of income levels paid more money in income taxes than they would have without the tax cuts. B) The treasury estimate if the share of tax cuts had not been enacted is 34%. C) Taxpayers in the top 1% of income levels paid a greater percentage of total federal income tax revenue than they would have without the tax cuts.