The graph below shows the relationship between the distance biked and the time spent biking for two different bikers in a road race. Which of the following accurately compares the speed of the two bikers? a. Biker A is going faster than Biker B by 5 miles per hour. b. Biker A is going slower than Biker B by 5 miles per hour. c. Biker A is going faster than Biker B by 10 miles per hour. d. Biker A is going slower than Biker B by 10 miles per hour.


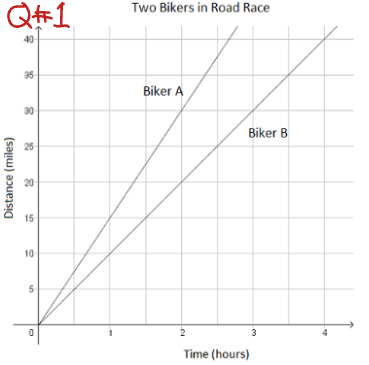
1. The graph below shows the relationship between the distance biked and the time spent biking for two different bikers in a road race.
Which of the following accurately compares the speed of the two bikers?
a. Biker A is going faster than Biker B by 5 miles per hour.
b. Biker A is going slower than Biker B by 5 miles per hour.
c. Biker A is going faster than Biker B by 10 miles per hour.
d. Biker A is going slower than Biker B by 10 miles per hour.
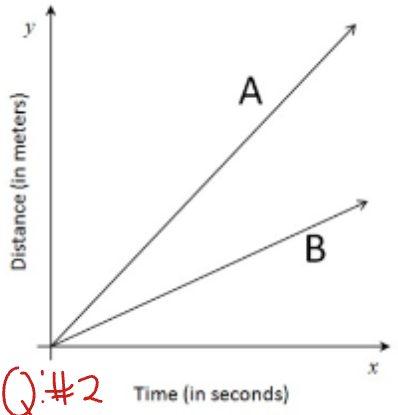
2. The graphs below show the distance two cars have traveled along the freeway over a period of several seconds. Car A is traveling 30 meters per second.
Which equation from those shown below is the best choice for describing the distance traveled by car B after x seconds? Explain
a. y = 85x
b. y = 60x
c. y = 30x
d. y = 15x


Trending now
This is a popular solution!

Step by step
Solved in 2 steps with 1 images


