Find and interpret a 90% confidence interval for the mean depth of all subterranean rodent burrows. The 90% confidence interval for μ is from______ to ________(round answers to 3 decimal places.)


Q: Here are summary statistics for randomly selected weights of newborn girls: n=228, x=32.8 hg,…
A: Given information- Sample size, n = 228 Significance level, α = 0.10 Sample mean, x-bar = 32.8 hg…
Q: For a given sample size and population standard deviation, which of the following is true in the…
A: For a given sample size and population standard deviation, the interval estimation of the population…
Q: Here are summary statistics for randomly selected weights of newborn girls: n=230 x=27.6 hg,…
A:
Q: Here are summary statistics for randomly selected weights of newborn girls: n= 167, x = 31.7 hg, s=…
A: Note: Hey there! Thank you for the question. As you have posted multiple questions, we have helped…
Q: Breathing rates, in breaths per minute, were measured for a group of 5 subjects at rest, and the…
A:
Q: Find the critical value zc necessary to form a confidence interval at the level of confidence shown…
A:
Q: (d) Based on your calculated 95% confidence interval, is it plausible that the underlying population…
A: (d) The null and alternative hypothesis is, From the sub part (c), The 95% confidence interval for…
Q: d. What is the value for the margin of error for a 95% confidence interval? Give the 95% confidence…
A: Sorry! Since you have posted a question with multiple sub-parts, we will solve first three sub-parts…
Q: I. Find the confidence interval of the problem with the following confidence level when population…
A: We have to find CI for u π = 36.5 , σ = 3 , n = 20 (a) 95% CI , p( -z < u < z ) = 0.95 z =…
Q: Use the confidence level and sample data to find a confidence interval for estimating the population…
A: Obtain the 98% confidence interval for the population mean. The 98% confidence interval for the…
Q: If 1850, 1970 is a confidence interval for a population mean. Find the value of the point estimator…
A:
Q: A 99% confidence interval (with n = 1, 018) estimates the actual mean amount of data usage a month…
A: It is given that, the 99% confidence interval is (5.701, 6.599).
Q: Which of the following statements is true regarding the width of a confidence interval for a…
A: Solution : The width of a confidence interval for a population proportion is narrower when the…
Q: The formula used to calculate a confidence interval for the mean of a normal population is x+ (t…
A: Given: The formula for confidence interval is x¯±t critical valuesn
Q: Use the following to answer the next two questions. A 2020 poll found that 520 out of 824 randomly…
A:
Q: find the point estimate ?̂ p^ and the margin of error ?.E.
A:
Q: The formula used to compute a confidence interval for the mean of a normal population when n is…
A: Thank you for posting the question. As your question has more than 3 parts, as per the policy, we…
Q: A 99% confidence interval (with n = 1, 018) estimates the actual mean amount of internet usage a…
A:
Q: For each confidence interval procedure, provide the confidence level. (Round the answers to the…
A:
Q: What is the appropriate t critical value for each of the following confidence levels and sample…
A: Given n=17 and 95% confidence
Q: Which of the following statements is TRUE? O a The larger the size of the sample, the greater is the…
A: 1) Sample size and confidence interval relation. We know that Confidence interval (CI) = x¯±Zcxσn…
Q: It is always good to have as narrow a confidence interval as possible, because a C.I. is an estimate…
A: Consider the sample mean is x̅ and the margin of error is E.
Q: Giving a test to a group of students, the grades and gender are summarized below A BC Total Male 185…
A: Here, p be the true population proportion of all male students who received a grade of C in the…
Q: The upper and lower bounds of a confidence interval, L and U, will be the same each time a new…
A:
Q: c. Find the confidence interval for the population mean with confidence level of 99%
A:
Q: Here are summary statistics for randomly selected weights of newborn girls: n=183, x=31.7 hg,…
A: From the provided information, Sample size (n) = 183 Sample mean (x̅) = 31.7 hg Sample standard…
Q: In a sample of 30 people, the average cost of a latte is $3.82. The standard deviation for the…
A: Given : n = 30 x¯ = 3.82 s = 1.66 Confidence level = 99%
Q: Using the information from above, with p′=0.265, q′=0.735, and n=340, what is the 95% confidence…
A: The 95% confidence interval for the proportion of the population who lease a car is:
Q: If (220 ,230) is a confidence interval for the population mean p, then the point estimator in this…
A:
Q: A survey of 25 randomly selected customers found the ages shown (in years). The mean is 33.16 years…
A: Given: n = 25 X = 33.16 S = 9.89 Formula Used: Confidence Interval = X ± Sntn-1 {When…
Q: #14 A medical devices company wants know the number of hours its MRI machines are used per day. A…
A:
Q: Which of the following statements is TRUE? O a The larger the size of the sample, the greater is the…
A: For the given statements select the correct choices
Q: Here are summary statistics for randomly selected weights of newborn girls: n=167, x= 30.6 hg, s=…
A: We have to find confidence interval for population Mean (μ) Since population standard deviation (σ)…
Q: When calculating a confidence interval on a conditional mean for a specific value of X, and a…
A:
Q: Here are summary statistics for randomly selected weights of newborn girls: n= 231, x= 31.1 hg, s =…
A: Given, n=231, x-=31.1hg and s=6.5hg.Formula for confidence interval for mean is,
Q: An economist is interested in studying the monthly incomes of consumers in a particular region. The…
A: Given:n=55, x=15000 and σ=1000
Q: You are trying to estimate the population mean p after taking a random sample from that population.…
A:
Q: Here are summary statistics for randomly selected weights of newborn girls: n= 158, x= 27.9 hg, s=…
A: Given information- Sample size (n) = 158 Mean x̅ = 27.9 hg Standard deviation (s) = 6.6 hg…
Q: Use the given confidence interval to find the point estimate ?̂p^. 0.14<?<0.84
A: Use the given confidence interval to find the point estimate ?̂p^. 0.14<?<0.84 The lower…
Q: Construct the confidence interval for the population mea
A:
Q: a) The following grades were achieved in a GCSE mathematics exam by a sample of 6 students: 92 80 69…
A:
Q: What critical value t∗t∗ from Table C would you use for a confidence interval for the mean of the…
A: We have to find critical value..
Q: For a given confidence level and sample size, which of the following is true in the interval…
A: The confidence interval for mean is given as X-Zα2σn≤μ≤X+Zα2σn
Q: When computing a confidence interval for the population mean µ when the population SD a is known,…
A: Given data: Confidence level = 85% Population standard deviation is known. To find: Critical value
Q: In the library of a university, the mean duration (in days) of the borrowing period of the books is…
A: “Since you have posted a question with multiple sub-parts, we will solve the first three sub-parts…
Q: 4. The formula used to calculate a confidence interval for the mean of a normal population when n is…
A: We have given that, For right-tailed Degree of freedom = 23 And for 95% confidence interval then…
Q: The formula used to calculate a confidence interval for the mean of a normalpopulation when n is…
A: The confidence interval is the interval in which the population parameter is likely to fall. For…
Q: A medical devices company wants to know the number of hours its MRI machines are used per day. A…
A: Given information- Population standard deviation, σ = 4 hours Confidence interval = 0.98…
Q: If [1740, 1850] is a confidence interval for a population mean. Find the value of the point…
A:
Zoologists studied the characteristics of the burrow systems of a subterranean rodent. A sample of 51 burrows had their depths, in centimeters, recorded in the following table. using technology.
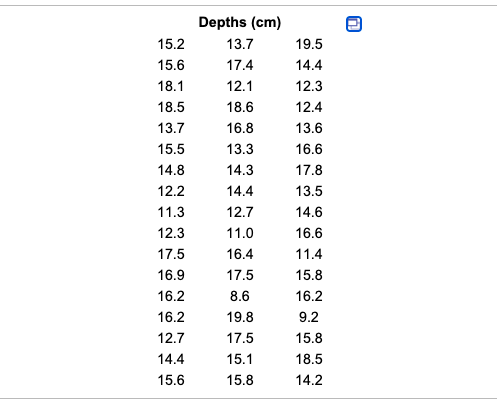
we have to find 90% confidence interval
in the given data
n = 51
sum of data = 764.1
therefore mean = sum of data/n
=764.1/51
=14.9824
variance = = = 6.31753
standard deviation = = 2.51347

Trending now
This is a popular solution!

Step by step
Solved in 2 steps


- A. The approximate standard deviation for the area under a gaussian curve for a population in the figure is .........A new machine has just been installed to produce printed circuit boards. One of the critical measurements is the thickness of the resistance layer. The quality control inspector randomly selects five boards each half-hour, measures the thickness, and records the results. The measurements (in millimeters) for the period 8:00 a.m. to 10:30 a.m. follow. Thickness (millimeters) Time 1 2 3 4 5 8:00 87.2 87.3 87.9 87.0 87.0 8:30 86.9 88.5 87.6 87.5 87.4 9:00 87.8 88.6 86.8 87.7 88.2 9:30 86.0 88.0 87.2 87.6 87.1 10:00 86.8 87.0 86.9 87.3 87.3 10:30 88.0 86.2 87.4 87.1 87.9 a. Determine the control limits for the mean and the range. (Leave no cells blank - be certain to enter "0" wherever required. Round your answers to 2 decimal places.) Mean of the sample means = LCL = UCL = Mean of the sample ranges = LCL = UCL =A new machine has just been installed to produce printed circuit boards. One of the critical measurements is the thickness of the resistance layer. The quality control inspector randomly selects five boards each half-hour, measures the thickness, and records the results. The measurements (in millimeters) for the period 8:00 a.m. to 10:30 a.m. follow. Thickness (millimeters) Time 1 2 3 4 5 8:00 87.2 87.3 87.9 87.0 87.0 8:30 86.9 88.5 87.6 87.5 87.4 9:00 87.8 88.6 86.8 87.7 88.2 9:30 86.0 88.0 87.2 87.6 87.1 10:00 86.8 87.0 86.9 87.3 87.3 10:30 88.0 86.2 87.4 87.1 87.9 Click here for the Excel Data Filea. Determine the control limits for the mean and the range. (Leave no cells blank - be certain to enter "0" wherever required. Round your answers to 2 decimal places.) Mean of the sample means = LCL = UCL = Mean of the sample ranges = LCL = UCL = c-1. Are any means out of control?multiple choice 1…
- A new machine has just been installed to produce printed circuit boards. One of the critical measurements is the thickness of the resistance layer. The quality control inspector randomly selects five boards each half-hour, measures the thickness, and records the results. The measurements (in millimeters) for the period 8:00 a.m. to 10:30 a.m. follow. Thickness (millimeters) Time 1 2 3 4 5 8:00 87.1 87.5 88.1 87.2 87.0 8:30 86.9 88.5 87.6 87.5 87.4 9:00 87.7 88.4 86.9 87.6 88.1 9:30 86.0 88.0 87.2 87.6 87.1 10:00 86.9 87.0 87.2 87.0 86.9 10:30 88.0 86.2 87.5 87.2 87.9 Click here for the Excel Data Filea. Determine the control limits for the mean and the range. (Leave no cells blank - be certain to enter "0" wherever required. Round your answers to 2 decimal places.) c-1. Are any means out of control?multiple choice 1…To qualify for a Master’s degree program in Business Administration at San Sebastian College, candidates must score in the top 20% on a mental ability test. The test has a mean of 180 and a standard deviation of 25. Find the lowest possible score to qualify. Assume the test scores are normally distributed. Solution: Step 1: Draw a figure and represent the area. Step 2: Find the z value. Step 3: Solution to find the lowest possible score.Calculate the incidence rate of prostate cancer in this population A population of 200 healthy men was followed up for the development of prostate cancer. 10 men were followed-up for 1 year and were then lost to follow-up. After being followed-up for 5 years, 10 men developed prostate cancer. The remaining men who never developed prostate cancer were followed for 10 years.
- A random sample of size 13 is taken from a population. A normal probability plot of the sample data shows no outliers but has significant curvature. The population standard deviation is unknown.Applying the Central Limit Theorem: The amount of contaminants that are allowed in food products is determined by the FDA (Food and Drug Administration). Common contaminants in cow milk include feces, blood, hormones, and antibiotics. Suppose you work for the FDA and are told that the current amount of somatic cells (common name "pus") in 1 cc of cow milk is currently 750,000 (note: this is the actual allowed amount in the US!). You are also told the standard deviation is 130000 cells. The FDA then tasks you with checking to see if this is accurate. You collect a random sample of 55 specimens (1 cc each) which results in a sample mean of 773830 pus cells. Use this sample data to create a sampling distribution. Assume that the population mean is equal to the FDA's legal limit and see what the probability is for getting your random sample. a. Why is the sampling distribution approximately normal? _____________ b. What is the mean of the sampling distribution? _____________ c. What is…10) Integrated circuits consist of electric channels that are etched onto silicon wafers. A certain proportion of circuits are defective because of "undercutting", which occurs when too much material is etched away so that the channels, which consist of the unetched portions of the wafers, are too narrow. A redesigned process, involving lower pressure in the etching chamber, is being investigated. The goal is to reduce the rate of undercutting to less than 5%. Out of the first 1000 circuits manufactured by the new process, only 32 show evidence of undercutting. If someone asks you the question "Can you conclude that the goal has been met?", what is the p-value that you'll report? Round the answer to four decimal places.
- Applying the Central Limit Theorem: The amount of contaminants that are allowed in food products is determined by the FDA (Food and Drug Administration). Common contaminants in cow milk include feces, blood, hormones, and antibiotics. Suppose you work for the FDA and are told that the current amount of somatic cells (common name "pus") in 1 cc of cow milk is currently 750,000 (note: this is the actual allowed amount in the US!). You are also told the standard deviation is 53000 cells. The FDA then tasks you with checking to see if this is accurate. You collect a random sample of 40 specimens (1 cc each) which results in a sample mean of 769495 pus cells. Use this sample data to create a sampling distribution. Assume that the population mean is equal to the FDA's legal limit and see what the probability is for getting your random sample. c. What is the standard deviation of the sampling distribution?Applying the Central Limit Theorem: The amount of contaminants that are allowed in food products is determined by the FDA (Food and Drug Administration). Common contaminants in cow milk include feces, blood, hormones, and antibiotics. Suppose you work for the FDA and are told that the current amount of somatic cells (common name "pus") in 1 cc of cow milk is currently 750,000 (note: this is the actual allowed amount in the US!). You are also told the standard deviation is 53000 cells. The FDA then tasks you with checking to see if this is accurate. You collect a random sample of 40 specimens (1 cc each) which results in a sample mean of 769495 pus cells. Use this sample data to create a sampling distribution. Assume that the population mean is equal to the FDA's legal limit and see what the probability is for getting your random sample. d. Assuming that the population mean is 750,000, what is the probability that a simple random sample of 40 1 cc specimens has a mean of at least…Applying the Central Limit Theorem: The amount of contaminants that are allowed in food products is determined by the FDA (Food and Drug Administration). Common contaminants in cow milk include feces, blood, hormones, and antibiotics. Suppose you work for the FDA and are told that the current amount of somatic cells (common name "pus") in 1 cc of cow milk is currently 750,000 (note: this is the actual allowed amount in the US!). You are also told the standard deviation is 59000 cells. The FDA then tasks you with checking to see if this is accurate. You collect a random sample of 40 specimens (1 cc each) which results in a sample mean of 767410 pus cells. Use this sample data to create a sampling distribution. Assume that the population mean is equal to the FDA's legal limit and see what the probability is for getting your random sample. a. Why is the sampling distribution approximately normal? b. What is the mean of the sampling distribution? c. What is the standard deviation of the…
