Find and interpret the z-score for North Car

Glencoe Algebra 1, Student Edition, 9780079039897, 0079039898, 2018
18th Edition
ISBN:9780079039897
Author:Carter
Publisher:Carter
Chapter10: Statistics
Section10.4: Distributions Of Data
Problem 19PFA

Related questions

Question
Find and interpret the z-score for North Carolina.
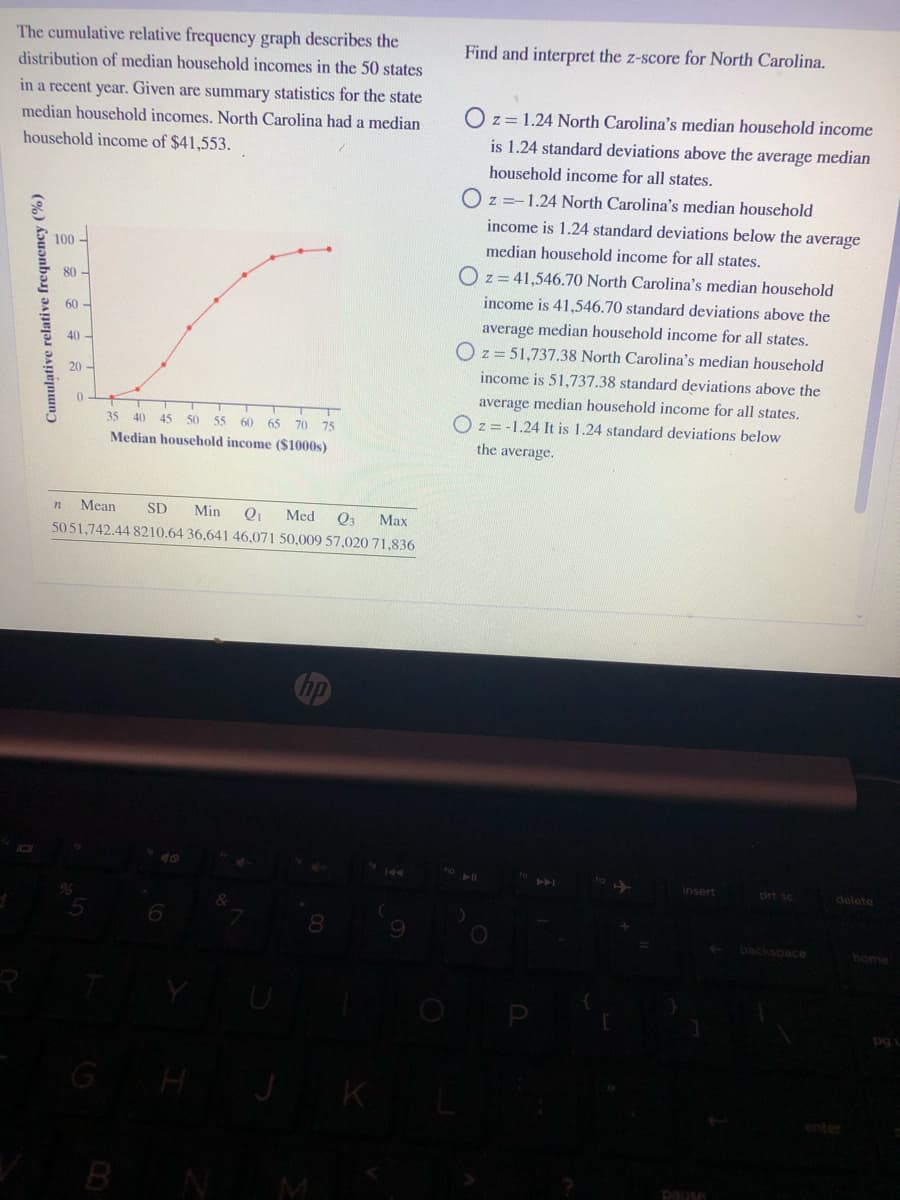
Transcribed Image Text:The cumulative relative frequency graph describes the
Find and interpret the z-score for North Carolina.
distribution of median household incomes in the 50 states
in a recent year. Given are summary statistics for the state
median household incomes. North Carolina had a median
O z= 1.24 North Carolina's median household income
household income of $41,553.
is 1.24 standard deviations above the average median
household income for all states.
O z =-1.24 North Carolina's median household
income is 1.24 standard deviations below the average
100 -
median household income for all states.
O z= 41,546.70 North Carolina's median household
80 -
income is 41,546.70 standard deviations above the
60 -
average median household income for all states.
40 -
O z= 51,737.38 North Carolina's median household
20
income is 51,737.38 standard deviations above the
average median household income for all states.
O z= -1.24 It is 1.24 standard deviations below
35
40
45 50 5
60
65
70 75
Median houschold income ($1000s)
the average.
Mean
SD
Min
Med
Q3
Max
5051,742.44 8210.64 36,641 46,071 50,009 57,020 71,836
Chp
insert
prt sc
delete
8
backspace
home
GH
K
enter
BNM
pause
Cumulative relative frequency (%)
Expert Solution
This question has been solved!
Explore an expertly crafted, step-by-step solution for a thorough understanding of key concepts.

This is a popular solution!

Trending now
This is a popular solution!

Step by step
Solved in 2 steps

Knowledge Booster


Learn more about
Need a deep-dive on the concept behind this application? Look no further. Learn more about this topic, statistics and related others by exploring similar questions and additional content below.Recommended textbooks for you
Glencoe Algebra 1, Student Edition, 9780079039897…
Algebra
ISBN:
9780079039897
Author:
Carter
Publisher:
McGraw Hill
Glencoe Algebra 1, Student Edition, 9780079039897…
Algebra
ISBN:
9780079039897
Author:
Carter
Publisher:
McGraw Hill