Find each of the followirig percentile points under the normal curve Show complete solution and sketch the normal curve showing the percentile points. 1.P97 ANATUAN 2. Pas 3. PA0
Find each of the followirig percentile points under the normal curve Show complete solution and sketch the normal curve showing the percentile points. 1.P97 ANATUAN 2. Pas 3. PA0

Glencoe Algebra 1, Student Edition, 9780079039897, 0079039898, 2018
18th Edition
ISBN:9780079039897
Author:Carter
Publisher:Carter
Chapter10: Statistics
Section: Chapter Questions
Problem 11MCQ

Related questions
Question
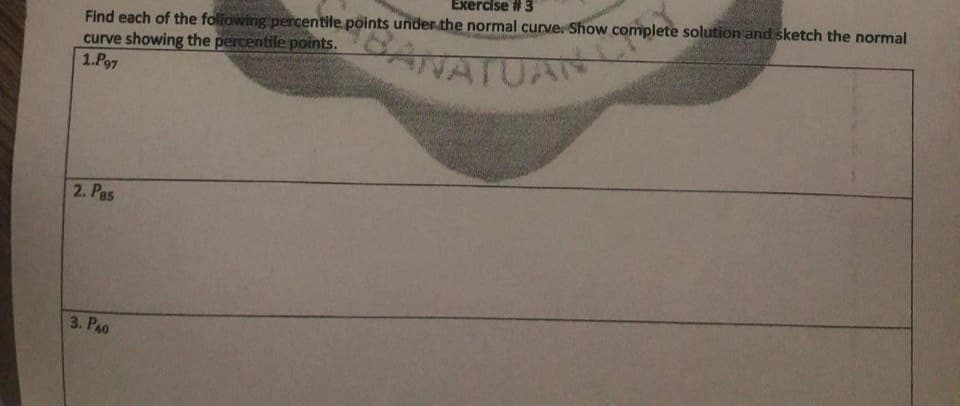
Transcribed Image Text:Exercise #3
Find each of the followinig percentile põints under the normal curve Show complete solution and sketch the normal
curve showing the percentile points.
1.P97
मापता
WATUAN
2. Pas
3. PA0
Expert Solution
This question has been solved!
Explore an expertly crafted, step-by-step solution for a thorough understanding of key concepts.

Step by step
Solved in 5 steps with 1 images

Recommended textbooks for you
Glencoe Algebra 1, Student Edition, 9780079039897…
Algebra
ISBN:
9780079039897
Author:
Carter
Publisher:
McGraw Hill
Glencoe Algebra 1, Student Edition, 9780079039897…
Algebra
ISBN:
9780079039897
Author:
Carter
Publisher:
McGraw Hill