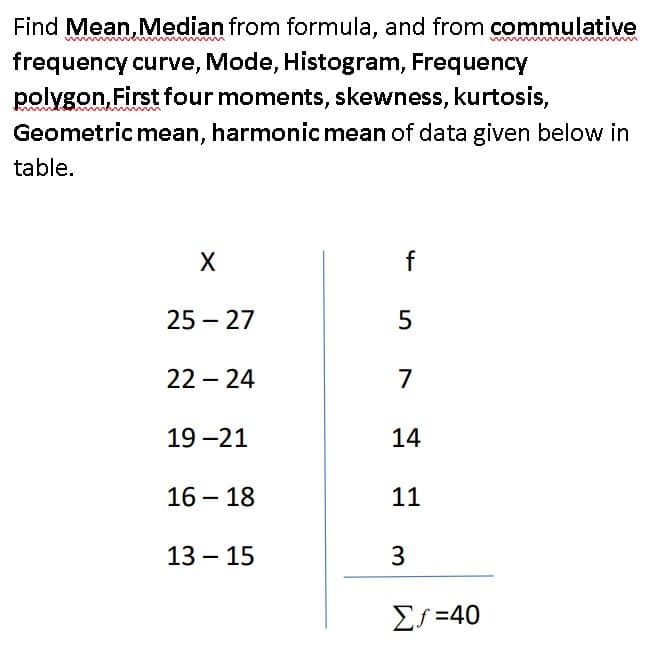
Find Mean, Median from formula, and from commulative frequency curve, Mode, Histogram, Frequency polygon, First four moments, skewness, kurtosis, Geometric mean, harmonic mean of data given below in table. f 25 – 27 5 22 – 24 7 19 -21 14 16 – 18 11 13 – 15 Es =40


Q: The durations (minutes) of 26 electric power outages in the community of Sonando Heights over the…
A: a) Mean:
Q: Find the mean of the data summarized in the given frequency distribution. Compare the computer mean…
A:
Q: The following data represent the grades of 50 students in the Statistics course, place these data in…
A: To Calculate such parameters we can use Excel. It is the easiest way to find these Statistics…
Q: The durations (minutes) of 26 electric power outages in the community of Sonando Heights over the…
A: Since you have posted a question with multiple sub-parts, we will solve first three sub-parts for…
Q: e durations (minutes) of 26 electric power outages in the community of Sonando Heights over t own…
A: Given data, 39,48,22,68,24,15,52,13,49,1,13,43,41,99,31,19,13,52,20,3,17,26,92,24,15,20 Sort the…
Q: Q3 The number of faculty listed for a variety of private colleges that offer only bachelor's degrees…
A: Since you have posted a question with multiple sub-parts, we will solve first three sub-parts for…
Q: The data below list the number of laptop computers owned by families in each of 40 homes in a…
A: We will make a frequency table using the given data Value Frequency 0 5 1 12 2 14 3 3…
Q: he following data show the lengths of boats moored in a marina. The data are ordered from smallest…
A: (a) mean = [14+17+18+20+20+21+23+24+25+25+25+26+26+27+27+27+28+29+29+32+33+33+34+35+37+39+45 ] / 27…
Q: he durations (minutes) of 26 electric power outages in the community of Sonando Heights over the…
A: The data set is 32, 46, 26, 67, 26, 10, 59, 10, 50, 3, 16, 49, 38, 99, 29, 22, 11, 51, 27, 1, 20,…
Q: Find the mean of the data summarized in the given frequency distribution. Compare the computed mean…
A: These are the inclusive type classes first we will change them to exclusive class intervals by…
Q: The number of social interactions of ten minutes or longer over a one-week period for a group of…
A:
Q: 3. Age of people who attended a concert has been recorded as follows: Age, x (years) 10 – 15…
A: Given :
Q: A) from the bellow table find the Mean? En=37 Classes 1-6| 7-12 | 13-18 | 19-24 25-30 | 31-36 37-42…
A: (A). Compute the mean of the given frequency distribution: The data represents the frequencies for…
Q: 15. Find the Geometric mean of the data given below: Marks Frequency Marks Frequency 6. 10 4-8 24-28…
A:
Q: The durations (minutes) of 26 electric power outages in the community of Sonando Heights over the…
A: a) mean=sum of the obersvationstotal number of obervations=35+48+...+13+1926=33.34615 For median and…
Q: The durations (minutes) of 26 electric power outages In the community of Sonando Helghts over the…
A:
Q: The number of social interactions of ten minutes or longer over a one-week period for a group of…
A: Solving question
Q: A Moving to another question will save this response Question 6 Find the mean of grouped data below.…
A: Class Frequency (f) Mid value (x) f⋅x 0.95-2.95 10 1.95 19.5 2.95-4.95 15 3.95 59.25…
Q: The number of social interactions of ten minutes or longer over a one-week period for a group of…
A: We know that Mean: It is the value of sum of the observations that divided by the total number of…
Q: Find the mean, median and mode of the following grouped data: Class Intervals Frequency 0-10 5…
A:
Q: The durations (minutes) of 26 electric power outages in the community of Sonando Heights over the…
A: Given data is32,47,26,69,26,9,57,10,51,5,17,47,40,99,31,20,14,48,24,2,18,25,87,28,14,17
Q: The durations (minutes) of 26 electric power outages in the community of Sonando Heights 37 49 24 67…
A:
Q: A laboratory technician records the life span (in months) of rats treated at birth with a fertility…
A: Calculate Mean from the following grouped data Class Frequency 0.5 - 2.5 15 2.5 - 5.5 19…
Q: The number of social interactions of ten minutes or longer over a one-week period for a group of…
A: Use the given data to form the excel table: x f x*f Cumulative frequency 4 12 48 12 9 17…
Q: Q # 3 Calculate Hamonic Mean and also Geometric Mean from the following discrete group data; Weight…
A: Given: Let x be a random variable that represents the weights (grams). The calculations for the…
Q: A laboratory technician records the life span (in months) of rats treated at birth with a fertility…
A: Solution
Q: D1 Time(Mins) 1.) A survey was taken among college students as to how many minutes they play a newly…
A: Note: We will answer the first question only as the exact one is not specified. Please resubmit the…
Q: The gas mileages (in miles per gallon) for 31 cars are shown in the frequency distribution.…
A: Gas Mileage (in miles per gallon) Frequency (f) Midpoint (x) f*x 30-33 8 31.5 252 34-37 14 35.5…
Q: The durations (minutes) of 26 electric power outages in the community of Sonando Heights over the…
A: A) Mean = sum of the counts \ number of counts…
Q: The number of social interactions of ten minutes or longer over a one-week period for a group of…
A: Solution
Q: The durations (mlinutes) of 26 electric power outages in the community of Sonando Helghts over the…
A: Given : The durations (minutes) of 26 electric power outages in the community of scenario Heights…
Q: Find the mean of the data summarized in the given frequency distribution. Compare the computed mean…
A: Given Data : Speed Frequency 42 - 45 25 46 - 49 16 50 - 53 7 54 - 57 3 58 - 61 2 For…
Q: Find the mean the median and the mode(s) if any for the given data. Round noninteger means to the…
A: The observations are 3, 28, 51, 4, 18, 23, 53, 12 Number of observations are 8.
Q: The number of social interactions of ten minutes or longer over a one-week period for a group of…
A: We have given that data. Mean = sum of all observations/total number of observations Median =…
Q: 1. The distance travelled (in kilometres) by a courier service motorcycle on 40 trips were recorded…
A: Since you have posted a question with multiple subparts, we will solve first three subparts for you.…
Q: c) The average amount of sleep, in hours, that 30 students in a Secondary Two get on a weekday is…
A: The formula for the geometric means is (∏xi)i=1n1n=(x1·x2·x3·…·xn)1n. Here, the number of terms is…
Q: Consider the frequency distribution to the right. Complete parts (a) through (c) below. Value…
A: Mean: The arithmetic mean(also called the mean) is the most commonly used measure of central…
Q: The number of social interactions of ten minutes or longer over a one-week period for a group of…
A: Consider the data that describe social interaction in a week (x) and number of college students…
Q: ers of defined words on those pages. 53 84 78 40 10 70 60 87 84 the following: a. Range b- Mean Mode
A: to find Range Mean Mode
Q: Find Mean, Median from formula, and from commulative frequency curve, Mode, Histogram, Frequency…
A: There are two types of measures used to summarize the data, they are measure of central tendency and…
Q: Find Mean, Median trom formula, and from commulative frequency curve, Mode, Histogram, Frequency…
A: The following frequency table is given: x f 0 - 1 64 1 - 2 92 2 - 3 141 3 - 4 86 4 - 5…
Q: The number of social interactions of ten minutes or longer over a one-week period for a group of…
A:
Q: Find the mean the median and the mode(s) if any for the given data. Round noninteger means to the…
A: The objective is to find the mean the median and the mode(s) if any for the given data.
Q: Using the computerised till in a shoe shop, the manager can predict what stock to order from the…
A: Since you have posted a question with multiple sub-parts, we will solve first three subparts for…
Q: Find Mean, Median from formula, and from commulative frequency curve, Mode, Histogram, Frequency…
A: Measure of central tendency are used to measure averages of the observations. There are five measure…
Q: Next Ques Use the frequency distribution shown below to construct an expanded frequency…
A: We have to find correct answer..
Q: The durations (minutes) of 26 electric power outage 36 49 24 66 25 12 55 12 se 33 20 14 5e 22 2 18…
A: According to the scenario, The durations in minutes of 26 electric power outages in the community of…
Q: ind the mean of the data summarized in the given frequency distribution. Compare the computed mean…
A: Given data, Class Lower limit Upper limit Mid point(Mi) Frequency(fi) Mi*fi 42-45 42 45 43.5 25…
Q: Find the mean, median, mode, range, and interquartile range of the data. Round your answers to the…
A: Mean or average of a data set is computed by dividing the sum of the observations by the total…
Q: The number of social interactions of ten minutes or longer over a one-week period for a group of…
A:


Trending now
This is a popular solution!

Step by step
Solved in 5 steps with 3 images

- Consider population data with ? = 250 and ? = 5. (a) Compute the coefficient of variation. (b) Compute an 88.9% Chebyshev interval around the population mean. (find lower and upper limit)The diameter of a metal shaft used in a disk-drive unit is normally distributed with mean 0.2508 in. and std. dev. 0.0005 in. The specification on the shaft have been established as (0.25-0.0015 in, 0.25+0.0015in) What fraction of the shafts produced conform to specifications? a). 0 b). 0.08 c). 0.16 d). 0.92Assume that you want to test the claim that the paired smaple data come from a population for which the mean difference is population mean d=0. Compute the value of the t test statistic. Round intermediate calculations to four decimal places as need and final answers to three decimal places as needed x 9 6 7 5 12 y 6 8 3 6 7
- The diameter of a metal shaft used in a disk-drive unit is normally distributed with mean 0.25 in. and std. dev. 0.0005 in. The specification on the shaft have been established as (0.25-0.002 in, 0.25+0.002in) What fraction of the shafts produced conform to specifications? a). 0 b). 0.5 c). 0.9 d). almost 1Ben thinks that people living in a rural environment have a healthierlifestyle than other people. He believes the average lifespan in the USA is 77years. A random sample of 12 obituaries from newspapers from rural towns inIdaho give x = 81.61 and s = 2.76. Does this sample provide evidence thatpeople living in rural Idaho communities live longer than 77 years?(a) State the null and alternative hypotheses: (Type "mu" for the symbol u , e.g.mu >1 for the mean is greater than 1, mu < 1 for the mean is less than 1, mu not= 1 for the mean is not equal to 1)H:H:(b) Find the test statistic, t =(c) Answer the question: Does this sample provide evidence that people living inrural Idaho communities live longer than 77 years? (Use a 10% level ofsignificanceThe hemoglobin count (HC) in grams per 100 milliliters of whole blood is approximately normally distributed with population mean 14 for healthy adult women. Suppose a female patient has had 19 laboratory blood tests during the past year. Her average HC is 13.49 with s = 2.48. Is there evidence that her average HC is not 14? (a) State the null and alternative hypotheses: (Type "mu" for the symbol μ� , e.g. mu >> 1 for the mean is greater than 1, mu << 1 for the mean is less than 1, mu not = 1 for the mean is not equal to 1)H0�0 : equation editor Equation Editor Ha�� : equation editor Equation Editor (b) Find the test statistic (give to at least 3 decimal places), t = equation editor Equation Editor (c) Answer the question: Is there evidence that her average HC is not 14? (Use a 1% level of significance)(Type: Yes or No)
- The hemoglobin count (HC) in grams per 100 milliliters of whole blood is approximately normally distributed with population mean 14 for healthy adult women. Suppose a female patient has had 14 laboratory blood tests during the past year. Her average HC is 14.84 with s = 2.4. Is there evidence that her average HC is not 14? (a) State the null and alternative hypotheses: (Type "mu" for the symbol μμ , e.g. mu >> 1 for the mean is greater than 1, mu << 1 for the mean is less than 1, mu not = 1 for the mean is not equal to 1)H0H0 : HaHa : (b) Find the test statistic, t = (c) Answer the question: Is there evidence that her average HC is not 14? (Use a 1% level of significance)(Type: Yes or No)Our hypothesis is that female super models have a height greater than the mean heights of women in general. The mean of the general population is 62.3 inches (5.2 ft). We sample 12 super models and get a mean of 69.6 inches (5.8 ft). Given a sample standard deviation of 2.4 (that means σ is unknown) and will use an alpha α of 0.01. Find the p value. (You can answer in an exponent like 1.23E-4 or in standard form, like 0.000123. Use inches in your caculation, not feet.) Hints...look for key words and numbers to tell you what test to use on your calculatorfourteen different video games showing alcohol use were observed. The duration times of alcohol use (in seconds) were recorded. When using this sample for a t test of the claim that the population mean is greater than 83 sec, what does df denote, and what is its value? 1.What does df denote? 2. The value of DF
- The diameter of a metal shaft used in a disk-drive unit is normally distributed with mean 0.2508 in. and std. dev. 0.0005 in. The specification on the shaft have been established as (0.25-0.0015 in, 0.25+0.0015in) If the process mean has been adjusted to 0.25 in, what fraction of the shafts produced does NOT conform to specifications? a). 0.0027 b). 0.0013 c).0.08 d). 0.16Before it was a defined quantity, separate groups of researchers independently obtained the following five results (all in km s−1 ) during experiments to measure the speed of light c: 299795 ± 5 299794 ± 2 299790 ± 3 299791 ± 2 299788 ± 4 Determine the best overall result which should be reported as a weighted mean from this set of measurements of c, and find the uncertainty in that mean result.Cardiologists use the short-range scaling exponent α1, which measures the randomness of heart rate patterns, as a tool to assess risk of heart attack. The article “Applying Fractal Analysis to Short Sets of Heart Rate Variability Data” compared values of α1 computed from long series of measurements (approximately 40,000 heartbeats) with those estimated from the first 300 beats to determine how well the long-term measurement (y) could be predicted the short-term one (x). Following are the data (obtained by digitizing a graph). Short Long 0.54 0.55 1.02 0.79 1.4 0.81 0.88 0.9 1.68 1.05 1.16 1.05 0.82 1.05 0.93 1.07 1.26 1.1 1.18 1.19 0.81 1.19 0.81 1.2 1.28 1.23 1.18 1.23 0.71 1.24 Note: This problem has a reduced data set for ease of performing the calculations required. This differs from the data set given for this problem in the text. Find a 95% confidence interval for the mean long-term measurement for those with short-term measurements…