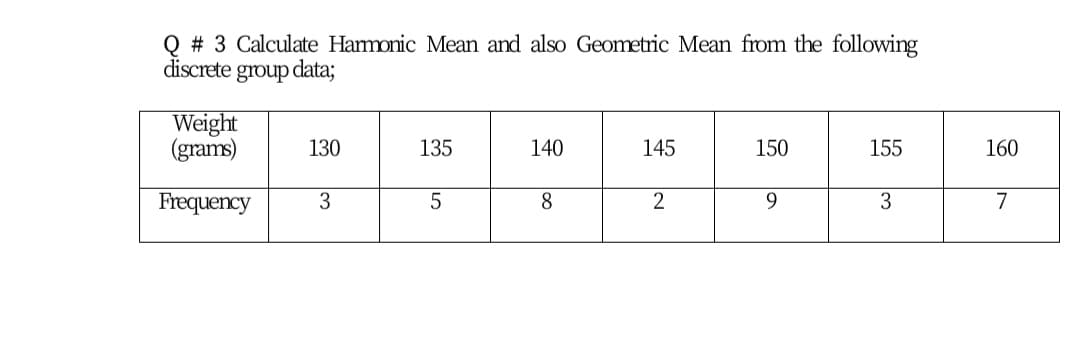
Q # 3 Calculate Hamonic Mean and also Geometric Mean from the following discrete group data; Weight (grams) 130 135 140 145 150 155 160 Frequency 3 8 2 9 3 7
Q: For the following grouped data find the frequency fi, class mid-point x; and the |Меan y ? 12 23 10…
A: Reviewing the information, given grouped data,
Q: Find the mean of the data summarized in the given frequency distribution. Low Temperature (o F)…
A:
Q: The following histogram represents the number of children visiting the park in evening at different…
A: We can create a data table for the given histogram. So it'll be easy to Calculate the given…
Q: Find the value of Mode from the following data : Size of item Frequency 100–110 4 110-120 6. 120-130…
A: Given data is Size of item Frequency 100 - 110 4 110 - 120 6 120 - 130 20 130 - 140 32…
Q: 10+ 8 4 1 4 7 7 10 13 16 19 data Based on the histogram above, what is the frequency of the class…
A: From the given histogram we can see that the value 8 belongs to class 7-10. And the frequency of…
Q: The following data related to the distance travelled by 55 villagers to buy their weekly…
A:
Q: Find the harmonic Mean for the following data: Class 10-20 20-30 30-40 40-50 50-60 60-70 70-80 80-90…
A: Harmonic mean is used to calculate the average of a set of numbers. The number of elements will be…
Q: The following are the prices of commodities in 2016 and 2017. Calculate a price index based on price…
A: Index number is used to measure the change in price over a period of time. It is broadly classified…
Q: The following are goals scored by a soccer team at each game in their recent season. 1 1 1 1 1 2. 3…
A: Goals Frequency 0 8 1 7 2 4 3 2 4 1 5 3 Total 25 Sum of all frequency = 25
Q: he following table gives the frequency distribution of the head circumference (in cm) for a sample…
A: Solution The given data is a grouped data.
Q: The following shows a linear correlation between the variables. 60 50 40 30 10 1 2 3 4 7 scatter…
A: Scatter plot is a type of chart which is used represent the relationship between two numerical…
Q: Q1: For the following grouped data find the frequency fi , class mid-point x; and the Mean y ? 12 23…
A: We will have to find group, frequency fi, class mid-point xi . Here we make class of length 10. The…
Q: Q3. The following data give the number of children per family for a sample of 30 families. 3. 3. 2.…
A: Given that Let Xi denotes the number of children per family for a sample of 30 families- 1 0 3 3 1…
Q: Example 2 Locate the mode from the following frequency distribution. Marks: 40 50 60 70 80 90…
A:
Q: Find the measures of center for following. Data Frequency 70 74 2 75 79 80-84 85 -89 7 90-94 95 -99…
A: Calculate Mean, Median, Mode from the following grouped data Class Frequency 70 - 74 2 75 -…
Q: 2 For the following data, state whether a frequency histogram or a column graph should be used, and…
A: Data can be organized graphically for interpretation in a single glance in Statistics. The two forms…
Q: Calculate the mean (all the three types) from the following data and comment on your solutions.…
A: Mean is the measure of central tendency. There are three types of mean. They are arithmetic mean,…
Q: Find the harmonic Mean for the following data: Class 10-20 20-30 30-40 40-50 50-60 60-70 70-80 80-90…
A: The harmonic mean is computed by x¯=∑f∑fx, where f is the frequency of x value. Because the data…
Q: Class (kg) Freq, f [80; 100) 4 [100; 120) [120; 140) 13 [140; 160) [160; 180) 5 40 The median is…
A:
Q: Find Bowley's coefficient of skewness for the following frequency distribution: No. of children per…
A: Solution:
Q: For the following frequncy data, х. f 3 6 12 18 12 10 15 The value of Arithmetic Mean will be,…
A:
Q: Using the following summary statistics, find the correlation coefficient to 4 decimal places. n=8,…
A: Introduction :- Here we have to find the correlation coefficient.
Q: Q/ The annual rainfall was measured in the Western Desert during a period of one year, and the…
A: Solution Given data is Then frequency table is
Q: For the following frequency table, if the average of data is 16 19 35 15 18 f 3. 1 O 18 and 18 O 18…
A: Given
Q: Q1: For the following grouped data find the frequency fi, class mid-point X; and the Mean y ? 12 23…
A: For the following we will find group, frequency and class mid-poin xi as, Group Frequency fi…
Q: Find the 7h decile and 60h percentile from the following data : Wages ( $) 30-40 40-50 50 60 60 70…
A:
Q: For this grouped data set: Scores | Frequencies 30-34 | 7 25-29 |…
A:
Q: Find the mean for the following data: Student Age (years) Number of Students 18 - 20 21 - 23 230 152…
A:
Q: Class (kg) Freq, f [80; 100) 4 [100; 120) [120; 140) 13 [140; 160) [160; 180) 5 40 The estimated…
A:
Q: For the following data, approximate the mean weekly grocery bill. The first column represents the…
A: Bill Frequency(x) Mid-values (x) x.f 135-139 140-144 145-149…
Q: From the problem 'try it yourself 2' the frequency distribution is as follows: Class Frequencyf Mid…
A: A cumulative frequency distribution is the sum of the class and all classes below it in a frequency…
Q: Low Temperature ( o F) | 40– 44 45–49 4 Find the mean of the data summarized in the given frequency…
A: 40-44 1 42 42 45-49 4 47 188 50-54 12 52 624 55-59 5 57 285 60-64 1 62 62
Q: c) The average amount of sleep, in hours, that 30 students in a Secondary Two get on a weekday is…
A: The formula for the geometric means is (∏xi)i=1n1n=(x1·x2·x3·…·xn)1n. Here, the number of terms is…
Q: Complete the FD table below and then: find 60th percentile: n=30 30₂2 = 15 5-7 10 (15.) Classes…
A: Given: Classes Frequency (f) 2-4 5 5-7 10 8-10 5 11-13 4 14-16 6 -- n=30
Q: The following table gives the age distribution for the number of deaths due to accidents for…
A: Given data
Q: SOLVE THE FOLLOWING PROBLEM FOR CENTRAL TENDENCY AND MATH SCORES F X FX <CF 59 - 74 111 75 - 90 143…
A: “Since you have asked multiple question, we will solve the first question for you. If you want any…
Q: Find the measures of center for following. Data Frequency 40 - 44 45 - 49 50 - 54 55 - 59 13 22 %3D…
A: Given information: Data Frequency 40-44 13 45-49 22 50-54 14 55-59 9 60-64 8 65-69 7…
Q: (b): Following Data are Blood Lead Concentrations of Group of workers in a country Blood Leads 0 – 9…
A: Given the data as Blood Leads Frequency 0 - 9 15 20 - 29 21 30 - 39 39 40 - 49 54 50 -…
Q: 5. Given: CLASS LIMITS FREQUENCY 61 63 2 64 66 67 69 12 70 72 15 73 75 8 76 78 79 81 3. e for the…
A: Hi! Thank you for the question, As per the honor code, we are allowed to answer three sub-parts at a…
Q: For the following pairs of data points (10, 100), (8, 120), (5, 200), (4, 200), (10, 90), (7, 110),…
A: Since you have asked multiple question, we will solve the first question for you. If youwant any…
Q: For the given data set: X 812 y 10 7 Part 1 of 6 2 15 11 5 | ! |; 6 13 19 2
A: Given : A dats set x y 8 10 12 7 2 15 11 6 5 13 19 2
Q: b- for the following data, (19, 32, 26, 71, 88, 45, 59), the Harmonic Mean (H) is 37.4406 O 37.6044…
A: To find: The harmonic mean
Q: Find the harmonic Mean for the following data: Class 10-20 20-30 30-40 40-50 50-60 60-70 70-80 80-90…
A: Mid - point(x) = Lower class limit+ Upper class limit 2 Example : Mid point…
Q: The data in the following table are the mathematic degrees of 130 pupil Mathematic degrees 10-19…
A: As per our guidelines we can solve first three sub part of question and rest can be reposted.
Q: 02: Answer the following questions: a) Find the harmonic mean for the following data: 3 7 8 16 19 b)…
A: (a) To find the harmonic mean for the following data: 3, 7, 8, 16, 19 Harmonic mean is the…
Q: A researo collected the following data: gather by school-aged children and young adults. She on…
A: We have to find relative frequncy and correct graph..
Q: Example Obtain the median for the following frequency distribution : 6 x: 1 2 3 4 7 8 9. f: 8 10 11…
A:
Q: 37 Find the 7" decile and 60th Wages (Rs.) 30-40 40-50 50-60 60-70 70-80 80-90 90-100 percentile…
A: Given : Classes f 30-40 1 40-50 3 50-60 11 60-70 21 70-80 43 80-90 32 90-100 9…
Q: Find out the combined mean for the following data X1 X2 60 25 70 35 40 30 30 O a. 46.92 O b. 45.54…
A:
Step by step
Solved in 2 steps