Find the area of the indicated region under the standard normal curve. Click here to view page 1 of the standard normal table. Click here to view page 2 of the standard normal table. The area between z= -1.5 and z=0.8 under the standard normal curve is (Round to four decimal places as needed.) *** -1.5 Q N
Find the area of the indicated region under the standard normal curve. Click here to view page 1 of the standard normal table. Click here to view page 2 of the standard normal table. The area between z= -1.5 and z=0.8 under the standard normal curve is (Round to four decimal places as needed.) *** -1.5 Q N

MATLAB: An Introduction with Applications
6th Edition
ISBN:9781119256830
Author:Amos Gilat
Publisher:Amos Gilat
Chapter1: Starting With Matlab
Section: Chapter Questions
Problem 1P

Related questions
Question
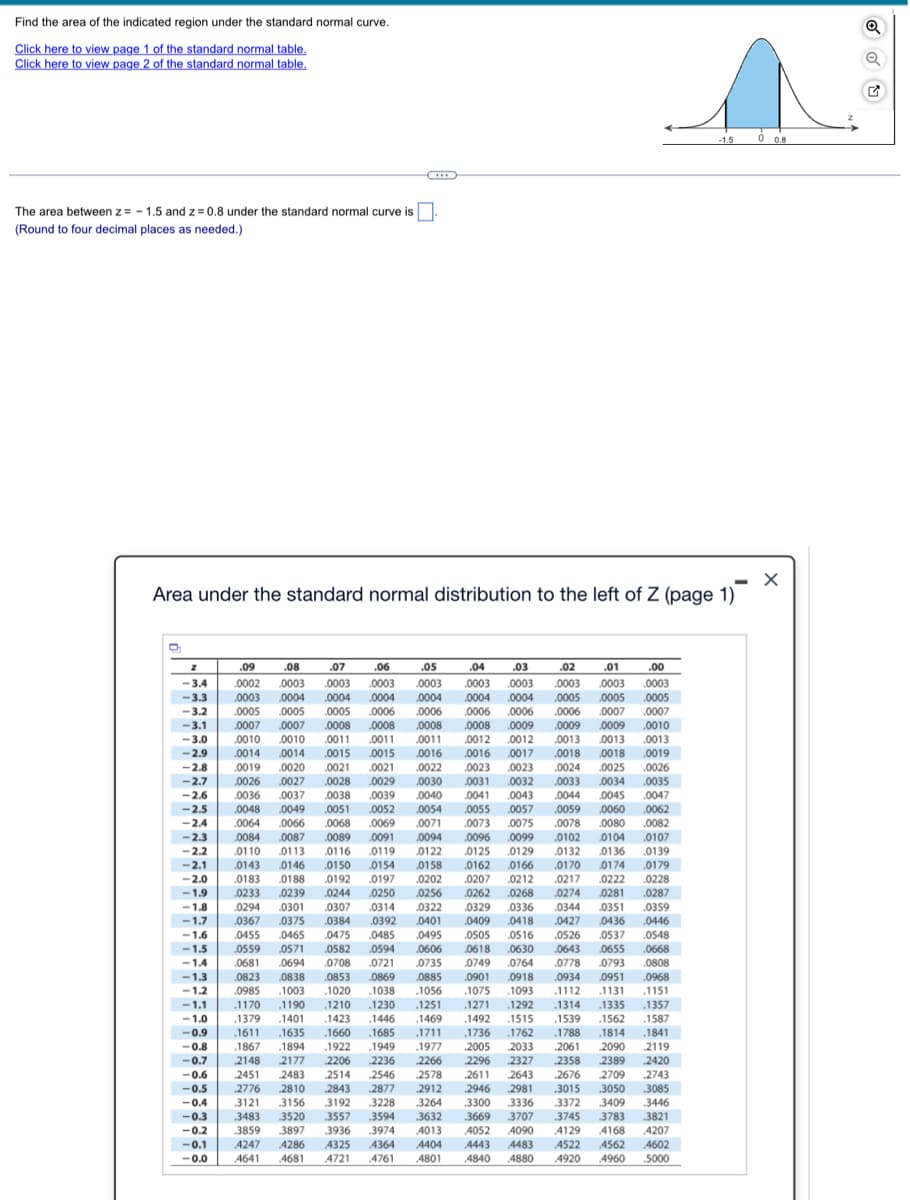
Transcribed Image Text:Find the area of the indicated region under the standard normal curve.
Click here to view page 1 of the standard normal table.
Click here to view page 2 of the standard normal table.
The area between z= -1.5 and z=0.8 under the standard normal curve is.
(Round to four decimal places as needed.)
←
D
Area under the standard normal distribution to the left of Z (page 1)
z
.01
.00
.0003 .0003
.07 .06 .05
.0003 .0003 .0003
0004 .0004 .0004
.0005 .0006 .0006
.0008 .0008 .0008
.0013
-2.9
.0019
.0026
-2.8
.0024 .0025
-2.7
.0033 0034
.09 .08
.04 .03
.02
-3.4 .0002 .0003
.0003 .0003 .0003
-3.3 .0003 .0004
0004 .0004 .0005 .0005 .0005
<-3.2 .0005 .0005
.0006 .0006 .0006 .0007 .0007
-3.1 0007 .0007
.0008 .0009 .0009 0009
0010
-3.0 .0010 .0010 .0011 .0011 0011
0012 0012 .0013 .0013
.0014 .0014 0015 .0015 .0016 .0016 .0017 .0018 0018
0019 0020 0021 .0021 .0022 .0023 .0023
.0026
0027
0028 .0029 .0030 .0031 0032
0035
.0036 0037 .0038 .0039 .0040 .0041 0043 0044 0045 .0047
.0048 .0049 .0051 .0052 .0054 .0055 .0057 .0059 0060 .0062
.0064 .0066 0068 .0069 .0071 .0073 .0075 .0078 0080 0082
0084 .0087 0089 .0091 .0094 0096 .0099 .0102 0104 0107
0110 0113 0116 0119 0122 0125 0129 0132 0136 .0139
0143 .0146 0150 0154 .0158 .0162 0166 0170 0174 .0179
0183 .0188 0192 .0197 0202 .0207 0212 0217 0222 0228
0244 .0250 0256 .0262 0268 .0274 0281 .0287
.0307 .0314 0322 0329 0336 0344 0351 0359
.0367 0375
0384 0392 0401 0409 0418
.0446
-1.6 0455 0465 0475 0485 0495 0505 0516
-1.5 .0559 .0571 0582 .0594 .0606
-1.4 .0681 0694 0708 0721 0735
-1.3 0823 0838 0853 0869 0885 0901 0918 .0934 0951
0968
-1.2 0985 .1003 .1020 .1038 .1056 .1075 .1093 1112 1131 1151
-1.1
1170 1190 .1210 1230 1251 .1271 .1292 .1314 .1335 .1357
-1.0 1379 1401 .1423 .1446 1469 .1492 1515 1539 .1562 1587
-0.9 .1611 1635 .1660 .1685 1711 .1736 1762 .1788 .1814
.1841
.1867 1894 1922 .1949 .1977 2005 2033 2061 2090 2119
2148 2177 2206 2236 .2266 2296 2327 2358 2389 .2420
2451 2483 2514 2546 2578 2611 2643 2676 2709 2743
2776 2810 2843 2877 2912 2946 2981 3015 .3050 3085
3121 3156 3192 3228 3264 3300 3336 .3372 3409 .3446
3483 3520 .3557 3594 .3632 .3669 3707 3745 3783 .3821
3859 3897 .3936 .3974 4013 4052 4090 4129 4168 4207
4247 4286 4325 4364 4404 4443 4483 4522 4562 4602
4641 4681 4721 4761 4801 4840 4880
-2.6
-2.5
-2.4
-2.3
-2.2
-2.1
-2.0
-1.9
-1.8
-1.7
0233 0239
0294 0301
0427 0436
0526 0537
0548
.0643 0655
.0668
0618 0630
0749 0764 .0778 0793
0808
-0.8
-0.7
-0.6
-0.5
-0.4
4920
4960
5000
-0.3
-0.2
-0.1
-0.0
-1.5
08
X
Q
Q
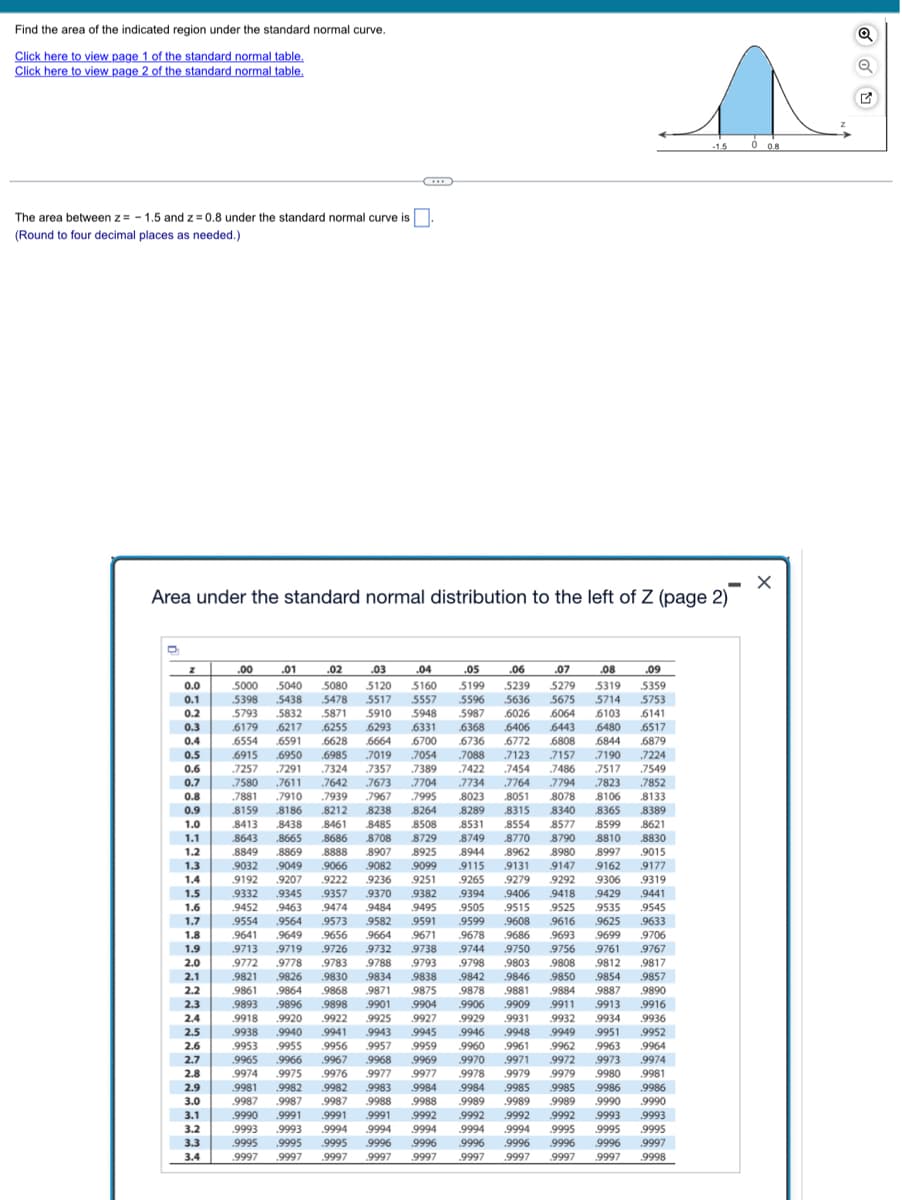
Transcribed Image Text:Find the area of the indicated region under the standard normal curve.
Click here to view page 1 of the standard normal table.
Click here to view page 2 of the standard normal table.
The area between z = -1.5 and z=0.8 under the standard normal curve is
(Round to four decimal places as needed.)
Area under the standard normal distribution to the left of Z (page 2)
5080 5120 5160
5398 5438 5478 5517
5793 5832
5871 5910
6179 6217 6255 6293
.6554 6591 6628 6664
6915 6950 6985
7590
7611
5239
5675 5714
5987 6026 6064 6103
6368 6406 6443
6736 6772 6808 6844
.7088 7123 7157 7190
7724 7764 7794 7873
8051 8078
8289 8315
8340 8365
8508 8531 8554
8749 8770
8944 8962
7673 7704
8577
8790
8980
2002
9989
9625
7852
0051 9952
-1.5 0 0.8
0006
9997 9997 9997 9998
X
O
Expert Solution
This question has been solved!
Explore an expertly crafted, step-by-step solution for a thorough understanding of key concepts.

Step by step
Solved in 2 steps with 2 images

Recommended textbooks for you
MATLAB: An Introduction with Applications
Statistics
ISBN:
9781119256830
Author:
Amos Gilat
Publisher:
John Wiley & Sons Inc

Probability and Statistics for Engineering and th…
Statistics
ISBN:
9781305251809
Author:
Jay L. Devore
Publisher:
Cengage Learning

Statistics for The Behavioral Sciences (MindTap C…
Statistics
ISBN:
9781305504912
Author:
Frederick J Gravetter, Larry B. Wallnau
Publisher:
Cengage Learning
MATLAB: An Introduction with Applications
Statistics
ISBN:
9781119256830
Author:
Amos Gilat
Publisher:
John Wiley & Sons Inc
Probability and Statistics for Engineering and th…
Statistics
ISBN:
9781305251809
Author:
Jay L. Devore
Publisher:
Cengage Learning
Statistics for The Behavioral Sciences (MindTap C…
Statistics
ISBN:
9781305504912
Author:
Frederick J Gravetter, Larry B. Wallnau
Publisher:
Cengage Learning

Elementary Statistics: Picturing the World (7th E…
Statistics
ISBN:
9780134683416
Author:
Ron Larson, Betsy Farber
Publisher:
PEARSON

The Basic Practice of Statistics
Statistics
ISBN:
9781319042578
Author:
David S. Moore, William I. Notz, Michael A. Fligner
Publisher:
W. H. Freeman

Introduction to the Practice of Statistics
Statistics
ISBN:
9781319013387
Author:
David S. Moore, George P. McCabe, Bruce A. Craig
Publisher:
W. H. Freeman