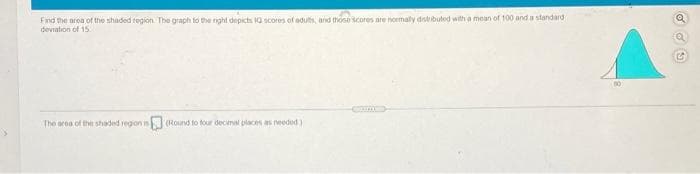
Find the area of the shaded tregion The graph to the nght depicts I0 scores of aduts, and those scores are normaly distrbuted with a mean of 100 and a standard deviation of 15 The area of the shaded regon is (Round to four decimal places as needed)
Q: nd the indicated IQ score. The graph to the right depicts IQ scores of adults, and those scores are…
A:
Q: Find the area of the shaded region. The graph to the right depicts IQ scores of adults, and those…
A:
Q: Find the area of the shaded region. The graph to the right depicts IQ scores of adults, and those…
A: Step-by-step procedure to obtain the area of the shaded region using MINITAB:Choose Graph >…
Q: Find the area of the shaded region. The graph to the right depicts IQ scores of adults, and those…
A: Mean = 100 Standard deviation = 15
Q: Find the area of the shaded region. The graph to the right depicts lQ scores of adults, and those…
A:
Q: Find the area of the shaded region. The graph to the right depicts IQ scores of adults, and those…
A:
Q: Find the area of the shaded region. The graph to the right depicts IQ scores of adults, and those…
A: Given,mean(μ)=100standard deviation (σ)=15
Q: Find the area of the shaded region. The graph to the right depicts IQ scores of adults, and those…
A: Given X~N(mean μ=100, standard deviations σ=15) P(102<X<122)=?
Q: Find the area of the shaded region. The graph to the right depicts IQ scores of adults, and those…
A: See the hand written anwser
Q: Find the area of the shaded region. The graph to the right depicts IQ Scores of adults, and those…
A:
Q: Find the area of the shaded region. The graph to the right depicts IQ scores of adults, and those…
A: Given X is normal Distributed with mean µ = 100.0 and standard deviation σ = 15.0 now will using…
Q: ind the area of the shaded region. The graph to the right depicts IQ scores of adults, and those…
A: It is given that the mean is 100 and standard deviation is 15.
Q: Find the area of the shaded region. The graph to the right depicts IQ scores of adults, and those…
A: Consider, X be the random variable that represents the IQ scores of adults.It is provided that, X is…
Q: Find the area of the shaded region. The graph to the right depicts 1Q scores of adults, and those…
A: Normal distribution is a continuous distribution which has many real life applications. Normal curve…
Q: Find the area of the shaded region. The graph to the right depicts IQ scores of adults, and those…
A:
Q: Find the area of the shaded region. The graph to the right depicts IQ scores of adults, and those…
A:
Q: Find the area of the shaded region. The graph to the right depicts IQ scores of adults, and those…
A:
Q: Find the area of the shaded region. The graph depicts IQ scores of adults, and those scores are…
A: 1) The Z-score of a random variable X is defined as follows: Z = (X – µ)/σ. Here, µ and σ are the…
Q: Find the area of the shaded region. The graph to the right depicts 10 scores of aduts, and those…
A: mean = 100 standard deviation = 15
Q: Find the area of the shaded region The graph to the right depicts IQ scores of adults, and those…
A:
Q: Find the area of the shaded region. The graph to the right depicts IQ scores of adults, and those…
A: From the provided information, Mean (µ) = 100 Standard deviation (σ) = 15 X~N (100, 15) Here X be a…
Q: Find the area of the shaded region. The graph to the right depicts IQ of adults and those scores are…
A: Given data,μ=100σ=15P(70<X<125)=?
Q: Find the area of the shaded region. The graph to the right depicts IQ scores of adults, and those…
A:
Q: Find the area of the shaded region. The graph to the right depicts lQ scores of adults, and those…
A: Provided information: Mean = 100 and Standard deviation = 15
Q: Find the area of the shaded region. The graph to the right depicts IQ scores of adults, and those…
A:
Q: Find the area of the shaded region. The graph to the right depicts IQ scores of adults, and those…
A: Given that, Mean = 100 Standard deviation = 15
Q: ind the area of the shaded region. The graph to the right depicts IQ scores of adults, and those…
A: It is given that the mean is 100 and standard deviation is 15.
Q: Find the area of the shaded region. The graph to the right depicts IQ scores of adults, and those…
A: Given datamean=100standard deviation=15
Q: Find the area of the shaded region. The graph to the right depicts IQ scores of adults, and those…
A:
Q: Find the area of the shaded region. The graph to the right depicts IQ scores of adults, and those…
A:
Q: Find the area of the shaded region. The graph to the right depicts IQ scores of adults, in those…
A: Given,μ=100σ=15P(X<85)=?
Q:
A: Given that IQ scores of adults is normally distributed with mean 100 and standard deviation 15. The…
Q: Assume that the readings at freezing on a bundle of thermometers are normally distributed with a…
A:
Q: Find the area of the shaded region. The graph to the right depicts IQ scores of adults, and those…
A:
Q: Find the area of the shaded region. The graph to the right depicts IQ scores of adults, and those…
A: Given information Mean µ = 100 Standard deviation σ = 15 x = 88
Q: ind the area of the shaded region. The graph to the right depicts IQ scores of adults, and those…
A: The standard normal variable Z is defined as, Z = (X – µ)/σ, where µ is the mean of the random…
Q: Find the area of the shaded region. The graph to the right depicts IQ scores of adults, and those…
A: The Normal distribution is also called as the Gaussian distribution. It is the most common…
Q: 11. Find the area of the shaded region. The graph depicts IQ scores of adults, and those scores are…
A: Normal Distribution : A random variable x is said be normal distribution with the probability…
Q: Find the area of the shaded region. The graph to the right depicts IQ scores of adults, and those…
A: Mean = 100 Standard deviation = 15
Q: Find the area of the shaded region. The graph to the right depicts IQ scores of adults, and those…
A:
Q: Find the area of the shaded region. The graph to the right depicts IQ scores of adults, and those…
A:
Q: Find the area of the shaded region. The graph to the right depicts IQ scores of adults, and those…
A: GivenMean(μ)=100standard deviation(σ)=15
Q: Find the area of the shaded region. The graph to the right depicts lIQ scores of adults, and those…
A:
Q: Find the area of the shaded region. The graph to the right depicts IQ scores of adults, and those…
A: The mean is 100 and the standard deviation is 15.
Q: Find the area of the shaded region The graph to the right depicts IQ scores of adults, and those…
A: Normal distribution is a continuous distribution which has many real life applications. Normal curve…
Q: Find the area of the shaded region. The graph to the right depicts IQ scores of adults and those…
A: Given,Mean (ν) = 100standard deviation (σ) = 15Let 'X' be the IQ scores of adults
Q: Find the area of the shaded region. The graph to the right depicts IQ scores of adults, and those…
A:
Q: Find the area of the shaded region. The graph to the right depicts IQ scores of adults, and those…
A: Obtain the Z-score for the random variable X equals 106. The Z-score for the random variable X…
Q: Find the area of the shaded region. The graph to the right depicts IQ scores of adults, and those…
A: The Z-score of a random variable X is defined as follows: Z = (X – µ)/σ. Here, µ and σ are the mean…
Q: Scores on a common final exam are approximately normally distributed with a mean of 72 and a…
A:
5
Step by step
Solved in 2 steps with 1 images
- find out the probability for given z score data area of the left of -2.5 area between -1.3698 and 1.3689Plot an F-distribution (in Excel) with an area of 0.10 at the right tail, with the degree of freedom for the numerator is 20 and the degree of freedom of the denominator is 16.Area to the left of-2.821 under a t distribution with 9 degrees of freedom
- Use the standard normal table to find the z-score that corresponds to the cumulative area 0.8365. If the area is not in the table, use the entry closest to the area. If the area is halfway between two entries, use the z-score halfway between the corresponding z-scores. Click to view page 1 of the standard normal table. LOADING... Click to view page 2 of the standard normal table. LOADING... z=nothing (Type an integer or decimal rounded to three decimal places as needed.)Find the indicated z-scores shown in the attached graph. First note that the shaded region is an area in between two z-scores. This means that the region is not a cumulative area from the left and to solve requires working instead with regions that are cumulative areas from the left. Thus, to find the z-scores in this situation, one needs to find the cumulative areas to the left of each unknown z-score. While either the Standard Normal Table or technology can be used to find the corresponding z-score, in this problem, use the table. The two values must be approached individually. First, consider the z-score for the lower 0.4649 to the left of z=0. The area to the left of this z-score is not given in the problem directly and must be found using the inner areas given. Note that 0.5 of any Standard Normal Distribution lies to the left of z=0 and that each half is divided into two unequal regions by the unknown z-scores. The larger region is known from the…Assume the sample is a random sample from a distribution that is reasonably normally distributed and we are doing inference for a sample mean. Find the area in a t-distribution above 1.5 if the sample has sizen : 8. = Round your answer to three decimal places. area =