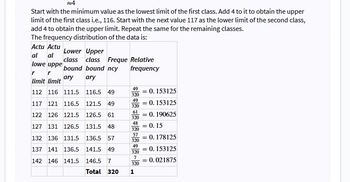
Classify the lengths into 7 equally wide class. Draw a histogram of the classified results Actual lower limit Actual upper limit Frequency Relative frequency Cumulative frequency Lengths 122 135 113 122 123 121 124 123 117 139 129 132 127 115 134 125 127 122 121 135 119 120 121 113 124 119 129 140 125 139 136 142 135 115 125 141 119 115 127 113 120 112 122 135 132 131 138 116 135 132 135 115 137 114 123 114 117 128 131 126 119 112 125 113 127 130 140 114 139 125 130 124 131 116 123 125 142 118 141 138 116 137 123 136 134 136 137 118 117 137 124 117 133 119 134 131 135 129 139 134 138 140 112 139 136 112 132 127 140 132 135 126 138 134 125 112 120 135 130 136 118 136 119 127 115 127 135 123 134 118 117 134 142 137 133 119 136 116 137 117 113 114 113 122 129 129 120 120 136 124 125 135 127 126 126 135 125 124 122 130 117 118 129 114 140 129 121 141 132 119 131 141 138 139 141 113 135 122 121 112 119 141 128 123 128 138 140 125 122 123 131 138 139 113 128 115 135 133 139 119 113 128 115 139 138 133 138 125 118 119 119 138 119 134 132 130 133 112 120 119 116 129 128 140 130 137 114 134 141 130 142 139 119 141 121 133 120 138 127 113 121 116 123 131 118 133 124 123 122 114 133 135 127 132 121 134 134 115 114 128 126 128 131 116 141 121 122 125 140 126 115 122 122 121 117 140 129 121 125 130 124 115 124 124 132 131 142 136 128 116 122 114 123 142 122 133 116 123 130 135 126 123 121 134 127 132 140 122 123 112 126 112 132 114 113 137 142 123 140 127 Use exce cells and show calculations.
Classify the lengths into 7 equally wide class.
Draw a histogram of the classified results
Actual lower limit Actual upper limit Frequency Relative frequency Cumulative frequency
Lengths
122
135
113
122
123
121
124
123
117
139
129
132
127
115
134
125
127
122
121
135
119
120
121
113
124
119
129
140
125
139
136
142
135
115
125
141
119
115
127
113
120
112
122
135
132
131
138
116
135
132
135
115
137
114
123
114
117
128
131
126
119
112
125
113
127
130
140
114
139
125
130
124
131
116
123
125
142
118
141
138
116
137
123
136
134
136
137
118
117
137
124
117
133
119
134
131
135
129
139
134
138
140
112
139
136
112
132
127
140
132
135
126
138
134
125
112
120
135
130
136
118
136
119
127
115
127
135
123
134
118
117
134
142
137
133
119
136
116
137
117
113
114
113
122
129
129
120
120
136
124
125
135
127
126
126
135
125
124
122
130
117
118
129
114
140
129
121
141
132
119
131
141
138
139
141
113
135
122
121
112
119
141
128
123
128
138
140
125
122
123
131
138
139
113
128
115
135
133
139
119
113
128
115
139
138
133
138
125
118
119
119
138
119
134
132
130
133
112
120
119
116
129
128
140
130
137
114
134
141
130
142
139
119
141
121
133
120
138
127
113
121
116
123
131
118
133
124
123
122
114
133
135
127
132
121
134
134
115
114
128
126
128
131
116
141
121
122
125
140
126
115
122
122
121
117
140
129
121
125
130
124
115
124
124
132
131
142
136
128
116
122
114
123
142
122
133
116
123
130
135
126
123
121
134
127
132
140
122
123
112
126
112
132
114
113
137
142
123
140
127
Use exce cells and show calculations.
Trending now
This is a popular solution!
Step by step
Solved in 2 steps with 1 images

Can you please show the cells how got frequency, relative frequency and cumulative frequency


