Find the area under the standard normal distribution curve. Draw the normal curve and shade the corresponding area. a. Between 0 and 1.37 b. To the right of -1.60 c. Between 1.53 and 3 d. Between -0.34 and -0.23 e. Between -1.96 and 2.33


Continuous Probability Distributions
Probability distributions are of two types, which are continuous probability distributions and discrete probability distributions. A continuous probability distribution contains an infinite number of values. For example, if time is infinite: you could count from 0 to a trillion seconds, billion seconds, so on indefinitely. A discrete probability distribution consists of only a countable set of possible values.
Normal Distribution
Suppose we had to design a bathroom weighing scale, how would we decide what should be the range of the weighing machine? Would we take the highest recorded human weight in history and use that as the upper limit for our weighing scale? This may not be a great idea as the sensitivity of the scale would get reduced if the range is too large. At the same time, if we keep the upper limit too low, it may not be usable for a large percentage of the population!
Find the area under the standard
a. Between 0 and 1.37
b. To the right of -1.60
c. Between 1.53 and 3
d. Between -0.34 and -0.23
e. Between -1.96 and 2.33
Note:
Hey, since there are multiple subparts posted, we will answer first three subparts. If you want any specific subpart to be answered then please submit that subpart only or specify the subpart in your message.
a)Between 0 and 1.37
Step-by-step procedure to probability using the MINITAB software:
- Choose Graph > Probability Distribution Plot
- choose View Probability > OK.
- From Distribution, choose ‘Normal’ distribution.
- Click the Shaded Area tab.
- Choose x value and Middle Tail for the region of the curve to shade.
- Enter the x1value as 0 and x2 value as 1.37.
- Click OK.
Output using MINITAB software is given below:
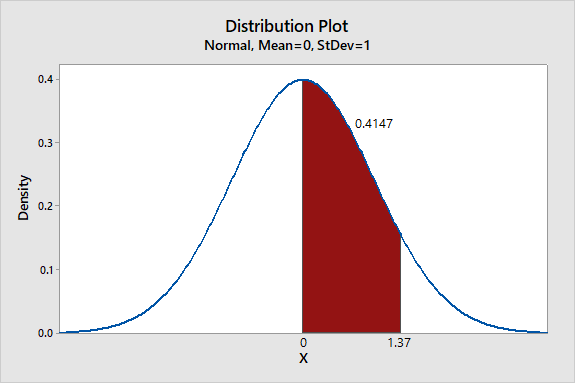
The area under 0 and 1.37 is 0.4147.
b)To the right of -1.60
Step-by-step procedure to probability using the MINITAB software:
- Choose Graph > Probability Distribution Plot
- choose View Probability > OK.
- From Distribution, choose ‘Normal’ distribution.
- Click the Shaded Area tab.
- Choose x value and Right Tail for the region of the curve to shade.
- Enter the x value as -1.6.
- Click OK.
Output using MINITAB software is given below:
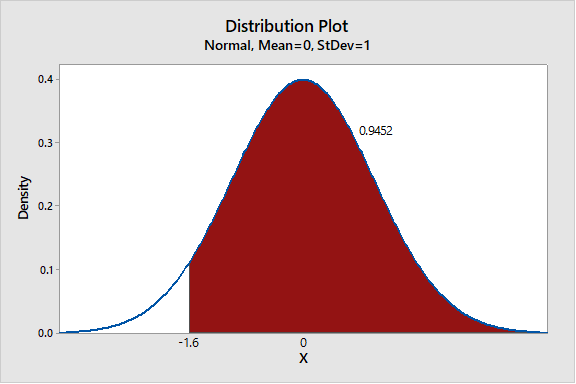
The area to the right of -1.60 is 0.9452.

Step by step
Solved in 3 steps with 3 images


