Find the confidence level and α for a 91% confidence interval. What is the confidence level? _______ (Type an integer or a decimal.)
Find the confidence level and α for a 91% confidence interval. What is the confidence level? _______ (Type an integer or a decimal.)

Glencoe Algebra 1, Student Edition, 9780079039897, 0079039898, 2018
18th Edition
ISBN:9780079039897
Author:Carter
Publisher:Carter
Chapter10: Statistics
Section10.4: Distributions Of Data
Problem 19PFA

Related questions
Topic Video
Question
Find the confidence level and α for a 91% confidence interval.
What is the confidence level?
_______
(Type an integer or a decimal.)
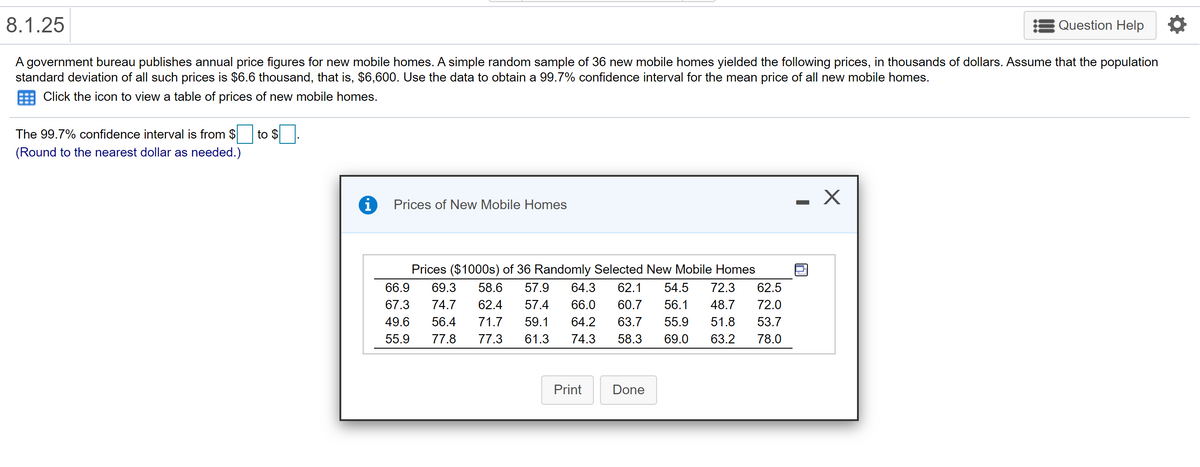
Transcribed Image Text:8.1.25
Question Help
A government bureau publishes annual price figures for new mobile homes. A simple random sample of 36 new mobile homes yielded the following prices, in thousands of dollars. Assume that the population
standard deviation of all such prices is $6.6 thousand, that is, $6,600. Use the data to obtain a 99.7% confidence interval for the mean price of all new mobile homes.
Click the icon to view a table of prices of new mobile homes.
The 99.7% confidence interval is from $
to $
(Round to the nearest dollar as needed.)
i
Prices of New Mobile Homes
Prices ($1000s) of 36 Randomly Selected New Mobile Homes
66.9
69.3
58.6
57.9
64.3
62.1
54.5
72.3
62.5
67.3
74.7
62.4
57.4
66.0
60.7
56.1
48.7
72.0
49.6
56.4
71.7
59.1
64.2
63.7
55.9
51.8
53.7
55.9
77.8
77.3
61.3
74.3
58.3
69.0
63.2
78.0
Print
Done

Transcribed Image Text:8.2.69
Question Help
Data on investments in the high-tech industry by venture capitalists are compiled by a corporation. A random sample of 18 venture-capital investments in a certain business sector yielded the accompanying data,
in millions of dollars. Determine and interpret a 95% confidence interval for the mean amount, µ, of all venture-capital investments in this business sector. Assume that the population standard deviation is $1.82
million. (Note: The sum of the data is $112.40 million.)
Click here to view the investment data.
Click here to view page 1 of the table of areas under the standard normal curve.
Click here to view page 2 of the table of areas under the standard normal curve.
The 95% confidence interval is from $
million to $
million.
(Round to two decimal places as needed.)
Investment Data
5.31
5.80
5.42
9.74
2.89
5.49
5.40
5.66
4.50
8.63
5.85
6.85
4.58
7.85
9.17
4.85
8.30
6.11
Print
Done
Expert Solution
This question has been solved!
Explore an expertly crafted, step-by-step solution for a thorough understanding of key concepts.

This is a popular solution!

Trending now
This is a popular solution!

Step by step
Solved in 2 steps with 1 images

Knowledge Booster


Learn more about
Need a deep-dive on the concept behind this application? Look no further. Learn more about this topic, statistics and related others by exploring similar questions and additional content below.Recommended textbooks for you
Glencoe Algebra 1, Student Edition, 9780079039897…
Algebra
ISBN:
9780079039897
Author:
Carter
Publisher:
McGraw Hill
Glencoe Algebra 1, Student Edition, 9780079039897…
Algebra
ISBN:
9780079039897
Author:
Carter
Publisher:
McGraw Hill