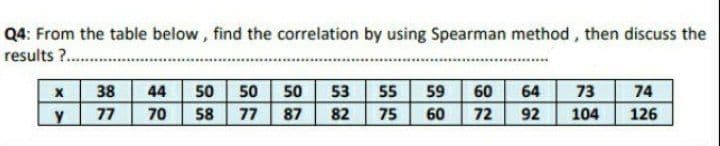
Q4: From the table below, find the correlation by using Spearman method , then discuss the results ? . 38 44 50 50 50 53 55 59 60 64 73 74 77 70 58 77 87 82 75 60 72 92 104 126


Q: The simple correlation coef.icients between profits X1), sales (X2) and ad- vertising expenditure…
A:
Q: 10. Describe the correlation for an r-value of -0.86. A. weak, negative correlation O B. strong,…
A: Given r value : -0.86 it is negative and hence it is close to -1 , it is strong correlation
Q: An environmentalist wants to determine the relationships between the numbers (in thousands) of…
A:
Q: Order the Scatter Plots below from highest to lowest based on the correlation that they represent.…
A: The correlation value lies between -1 to 1.
Q: 3. Explain the difference between a correlation of r = .5, and r = -.5.
A: Explain the difference between a correlation of r = .5, and r = -.5. The difference between the…
Q: Select the most appropriate response. Given the length of a human's femur, x, and the length of a…
A: Determine whether the correlation between given the length of a human's femur, x, and the length of…
Q: John used the formula for calculating the linear correlation coefficient r and got the value 1.3284.…
A:
Q: Calculate correlation coefficient from the following information: N= 10, ΣX= 140, ΣΥ= 150, Σ(Χ- 10,…
A:
Q: A researcher measures the following correlation: r = -0.21. What is the value of the coefficient of…
A: Givencorrelation coefficient(r)=-0.21
Q: b) Compute the Correlation Coefficient for your line from (a). c) Using your answer to (b), Is there…
A: 2) a) The slope is, b=n∑xy-∑x∑yn∑x2-∑x2=5×33974-409×4135×33643-4092=953934=1.020343≈1.0203 The…
Q: (b) Would you say the correlation is low, moderate, or strong? positive or negative? O moderate and…
A:
Q: Q5: From the table below , find the correlation by using Spearman meth discuss the results ? 5 17 27…
A: we are given the values of x and y to find correlation and R2
Q: Calculate coefficient of correlation for the following data by short-cut 58 62 66 68 70
A: From the given sample data : n=7 , ƩX=450 , ƩY=436 , ƩX2=29188 , ƩY2=28070 , ƩXY=28376 Our aim is to…
Q: Which value of r indicates a stronger correlation: r= 0.706 or r= -0.926? Explain your reasoning.…
A: Given, The objective is to find which value of r indicates a stronger correlation. r = 0.706 or…
Q: How large a sample is needed for a correlation of r = 0.54 to be significant using a two-tailed test…
A: It is given that the level of significance is 0.05.
Q: Use the data corresponding to weights and heights of males. What is the best estimate of the height…
A: A linear regression model corresponds to a linear regression model that minimizes the sum of squared…
Q: An environmentalist wants to determine the relationship between the number of fires, in thous…
A: Correlation value: r=0.769
Q: Which value of r indicates a stronger correlation: r=0.834 or r=−0.914?
A: We have given that, r = 0.83 or r=−0.914 We have to explain which value of r indicates a stronger…
Q: Q5: From the table below, 38 44 50 50 50 53 55 59 60 64 73 74 77 70 58 77 87 82 75 60 72 92 104 126…
A: Solution-: We find For Correlation (By Deviation Method)
Q: If the correlation coefficient between two variables is r = .86, we can interpret which of the…
A: The types of correlation are: Positive correlation: That is, as one of the variable increases…
Q: Q17 Which value of the following values of r indicates the strongest correlation? 0.4 0 -0.65…
A: Correlation coefficients:- The correlation coefficients measures the direction & strength of a…
Q: L is 75, or 125? or is it about the same for BOUI! J. A teaching assistant gives a quiz with 10…
A: Sample data: The average number of right answers is 6.4 with an SD of 2.0; the average number of…
Q: Imagine that there are only two points in a scatterplot. 7. How do you position these points so that…
A: Since you have asked multiple questions, we will solve the first question for you. If you want any…
Q: Which value of the coefficient of correlation r indicates a stronger correlation than -0.85? o a.…
A:
Q: Find Co-efficient of correlation from following results. N = 10, Mean x = 5, Mean y = 7 and sun of…
A:
Q: Campute the correlation co-efficient between the variables X and Y represented b) following table: X…
A: The formula for the calculation of correlation co-efficient is r=n∑xy−∑x⋅∑yn∑x2−∑x2×n∑y2−∑y2.
Q: Find probable error, when the coefficient of correlation is 0.8 and number of items is 64 and…
A:
Q: 2. Find the r- value for the correlation between the scores of 5 selected Grade 12 students on the…
A: The data given is the scores of 5 selected grade and we need to calculate the correlation…
Q: Explain the difference between a correlation of r =.3 and r =7. What does a larger value r…
A: Correlation: Correlation a measure which indicates the “go-togetherness” of two data sets. It can be…
Q: A researcher measured the following correlation: r=.21. What is the value of the coefficient of…
A:
Q: Use the paired data below to test the claim that there is a correlation between x and y, using…
A: We have given that, The data set are, X :- 46.6, 27.7, 43.1, 29, 34.8 Y:- 8, 8, 3,…
Q: the strength of correlation is indicated by: both (a) and (b) (B) its sign (+ or -) None of the…
A: the strength of correlation is indicated by
Q: In the table below are the scores of the students in General Mathematics and Physics. Calculate the…
A:
Q: In a university where calculus is a prerequisite for the statistics course, a sample of students was…
A: Given: Calculus Statistics 62 83 67 72 92 87 84 78 87 79 84 79 75 85 55 60
Q: What is the r2value if the obtained correlation is r= 0.70? a. 0.049 b. 0.49 c. 1.40 d.…
A: Here we need to find the value of the coefficient of determination from the given value of…
Q: A random sample of non-industrialized countries was selected, and the life expectancy in years is…
A: Given : X Y 69.7 73.8 72.9 77.8 61.9 64.5 76.2 78.3 70.3 64 83.2 73.5
Q: Which plot indicates a correlation of 0.7? Y & R 8 50 T 10
A: Here, first figure shows negative correlation because trend line goes negative axis.
Q: Which of the following result is the strongest correlation? r=.68, p=.03
A: Correlation: The extent of linear relationship between two variables is called as correlation.…
Q: If the correlation coefficient is 0.930, what is the unexplained variation
A:
Q: The correlation between midterm and final grades for 300 students is 0.620. If 5 points are added to…
A: Correlation Coefficient: Let (x1, y1), (x2, y2), ... , (xn, yn) be n set of observations for the…
Q: Distinguish the correlation shown in the graph below. Summarize why it is the chosen correlation. S…
A: The correlation shown in the graph is the Pearson correlation. The Pearson correlation denotes a…
Q: Which value of r indicates a stronger correlation than .40? -.80 .30 -.30 .38
A: If the correlation value is nearer to either -1 or +1 then the correlation is stronger than 0.40.
Q: Which r is the strongest correlation? O -0.8 O-0.18 O -0.09 O 0.711 O 0.4
A: Correlation coefficient is used to find the relationship between two quantitative variables. The…
Q: Find out the correlation coefficient by the concurrent deviation method: 84 80 86 86 88 102 100 110…
A:
Q: 19. Use the scatter plot below What type of correlation do yc ee? (a) If your answer is positive…
A: The scatter plot is given to find the type of correlation.
Q: Which scatter plot shown has a correlation coefficient, r, closest to 0?
A: Correlation coefficient: The correlation coefficient (r) is used to find how strongly the variables…
Q: Which of the following correlation (r) show a negative association between 2 variables?
A: The correlation coefficient r shows the strength and direction of the linear relationship between…
Q: (b) Compute the correlation coefficient between the price of eggs and the price of milk. Round the…
A: Given data, Dozen eggs (x) gallon of milk(y) 1.77 3.58 1.94 3.58 1.67 3.47 1.65 3.47…
Q: The following exercises are based on the following sample data consisting of numbers of enrolled…
A: The linear correlation coefficient, r is provided as 0.499. The coefficient of determination, r2 =…

Step by step
Solved in 2 steps with 2 images

- For the following exercises, use Table 4 which shows the percent of unemployed persons 25 years or older who are college graduates in a particular city, by year. Based on the set of data given in Table 5, calculate the regression line using a calculator or other technology tool, and determine the correlation coefficient. Round to three decimal places of accuracyFor the following exercises, match each scatterplot with one of the four specified correlations in Figure 9 and Figure 10. 14. r = 0.95For the following exercises, consider the data in Table 5, which shows the percent of unemployed in a city ofpeople25 years or older who are college graduates is given below, by year. 41. Based on the set of data given in Table 7, calculatethe regression line using a calculator or othertechnology tool, and determine the correlationcoefficient to three decimal places.
- For the following exercises, consider the data in Table 5, which shows the percent of unemployed ina city of people 25 years or older who are college graduates is given below, by year. 40. Based on the set of data given in Table 6, calculate the regression line using a calculator or other technology tool, and determine the correlation coefficient to three decimal places.For the following exercises, consider this scenario: The population of a city increased steadily overa ten-year span. The following ordered pairs show the population and the year over the ten-year span (population, year) for specific recorded years: (3,600,2000);(4,000,2001);(4,700,2003);(6,000,2006) 44. What is the correlation coefficient for this model tothree decimal places of accuracy?A scientist suspects that as a person’s stress level changes, so does the amount of his or her impulse buying. With N = 72, his r is +.38. Using this given information complete the 6 step hypothesis test for correlations. Assume α = .05.
- The readout of the correlation is r = 0.8162 with a p-value of 0.0022. What does the scatterplot reveal that is missed from the correlation results?Find the coefficient of determination, given that the value of the linear correlation coefficient, r, is 0.681. (Round to four decimal places.)Compute r, the correlation coefficient, using the following data. R=_____ (round to three decimal places)
