(b) Would you say the correlation is low, moderate, or strong? positive or negative? O moderate and positive O low and negative O low and positive O strong and negative O moderate and negative O strong and positive
(b) Would you say the correlation is low, moderate, or strong? positive or negative? O moderate and positive O low and negative O low and positive O strong and negative O moderate and negative O strong and positive

Chapter5: Exponential And Logarithmic Functions
Section5.5: Exponential And Logarithmic Models
Problem 4ECP

Related questions
Question
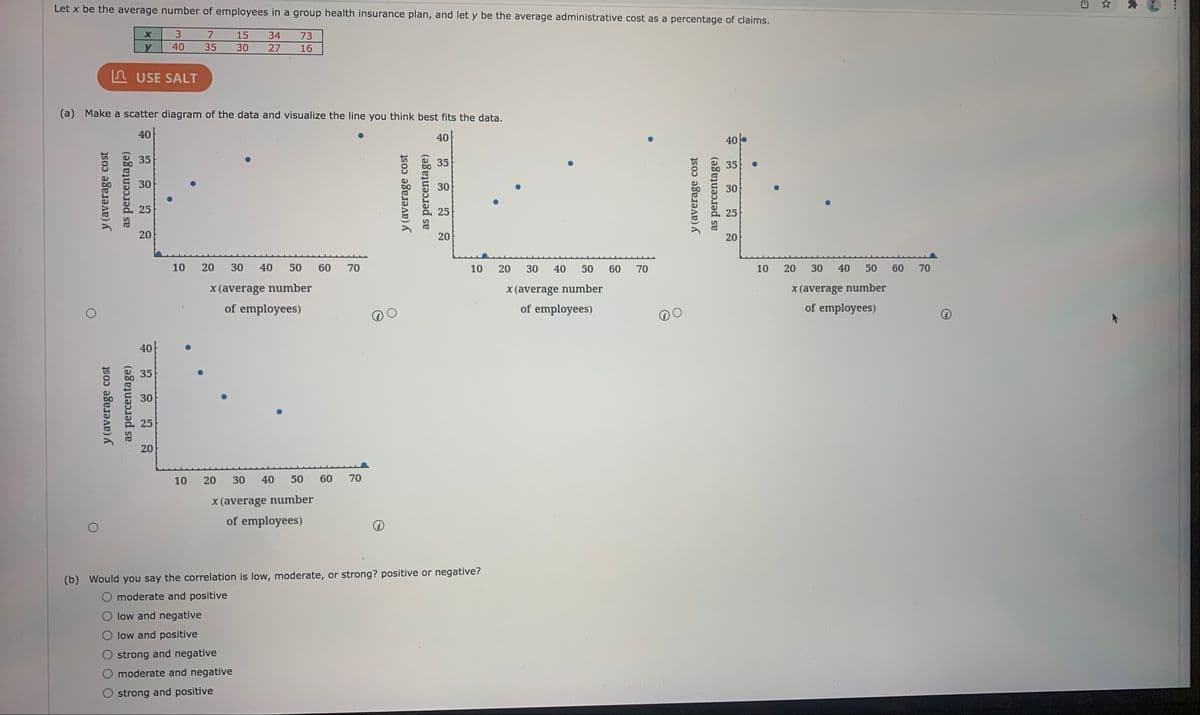
Transcribed Image Text:Let x be the average number of employees in a group health insurance plan, and let y be the average administrative cost as a percentage of claims.
3.
7
15
34
73
y
40
35
30
27
16
A USE SALT
(a) Make a scatter diagram of the data and visualize the line you think best fits the data.
40
40
40
35
35
35
30
30
30
25
25
25
20
20
20
10
20
30
40
50
60 70
10
20
30
40
50
60
70
10
20
30
40
50
60
70
x (average number
X (average number
X(average number
of employees)
of employees)
of employees)
40
35
30
25
20
10
20
30
40
50
60
70
X (average number
of employees)
(b) Would you say the correlation is low, moderate, or strong? positive or negative?
moderate and positive
low and negative
O low and positive
O strong and negative
moderate and negative
O strong and positive
y (average cost
y (average cost
as percentage)
as percentage)
y (average cost
as percentage)
y (average cost
as percentage)
Transcribed Image Text:7713184
10
20
30
40
50
60
70
X(average number
of employees)
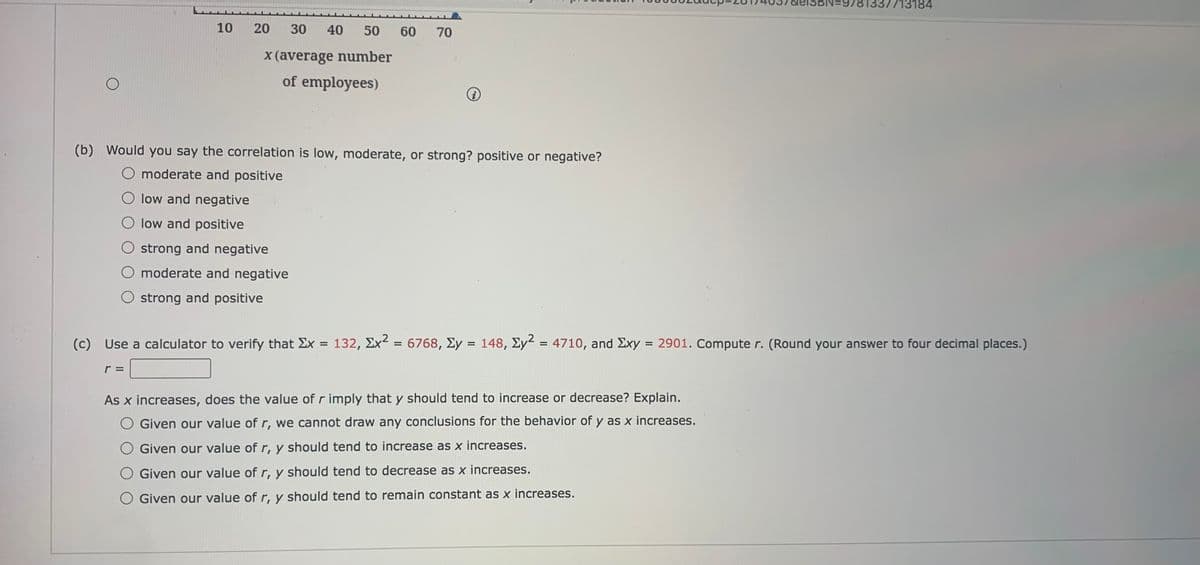
(b) Would you say the correlation is low, moderate, or strong? positive or negative?
O moderate and positive
O low and negative
O low and positive
O strong and negative
O moderate and negative
O strong and positive
(c)
Use a calculator to verify that Ex = 132, Ex2
6768, Ey = 148,
Ey?
4710, and Exy = 2901. Compute r. (Round your answer to four decimal places.)
%3D
%3D
%3D
r =
As x increases, does the value of r imply that y should tend to increase or decrease? Explain.
O Given our value of r, we cannot draw any conclusions for the behavior of y as x increases.
O Given our value of r, y should tend to increase as x increases.
Given our value of r, y should tend to decrease as x increases.
Given our value of r, y should tend to remain constant as x increases.
Expert Solution
This question has been solved!
Explore an expertly crafted, step-by-step solution for a thorough understanding of key concepts.

This is a popular solution!

Trending now
This is a popular solution!

Step by step
Solved in 4 steps with 4 images

Recommended textbooks for you

Trigonometry (MindTap Course List)
Trigonometry
ISBN:
9781337278461
Author:
Ron Larson
Publisher:
Cengage Learning

Algebra & Trigonometry with Analytic Geometry
Algebra
ISBN:
9781133382119
Author:
Swokowski
Publisher:
Cengage
Trigonometry (MindTap Course List)
Trigonometry
ISBN:
9781337278461
Author:
Ron Larson
Publisher:
Cengage Learning
Algebra & Trigonometry with Analytic Geometry
Algebra
ISBN:
9781133382119
Author:
Swokowski
Publisher:
Cengage

Big Ideas Math A Bridge To Success Algebra 1: Stu…
Algebra
ISBN:
9781680331141
Author:
HOUGHTON MIFFLIN HARCOURT
Publisher:
Houghton Mifflin Harcourt

Functions and Change: A Modeling Approach to Coll…
Algebra
ISBN:
9781337111348
Author:
Bruce Crauder, Benny Evans, Alan Noell
Publisher:
Cengage Learning