Find the equation of the regression line for the given data. Then construct a scatter plot of the data and draw the regression line. (The pair of variables have a significant correlation.) Then use the regression equation to predict the value ol each of the given x-values, if meaningful. The number Hours spent studying, x Test score, y hours 6 students spent for a test and their scores on that test are shown below. (a) x=2 hours (c) x= 15 hours 4 (b) x= 2.5 hours (d) x= 4.5 hours 39 45 50 49 64 71 O D. not meaningful (b) Predict the value of y for x=2.5. Choose the correct answer below. O A. 51.4 O B. 61.2 OC. 112.8 O D. not meaningful (c) Predict the value of y for x = 15. Choose the correct answer below. O A. 112.8 O B. 48.9 O C. 51.4 O D. not meaningful (d) Predict the value of y for x4.5. Choose the correct answer below. O A. 61.2 O B. 48.9 O C. 112.8 O D. not meaningful
Find the equation of the regression line for the given data. Then construct a scatter plot of the data and draw the regression line. (The pair of variables have a significant correlation.) Then use the regression equation to predict the value ol each of the given x-values, if meaningful. The number Hours spent studying, x Test score, y hours 6 students spent for a test and their scores on that test are shown below. (a) x=2 hours (c) x= 15 hours 4 (b) x= 2.5 hours (d) x= 4.5 hours 39 45 50 49 64 71 O D. not meaningful (b) Predict the value of y for x=2.5. Choose the correct answer below. O A. 51.4 O B. 61.2 OC. 112.8 O D. not meaningful (c) Predict the value of y for x = 15. Choose the correct answer below. O A. 112.8 O B. 48.9 O C. 51.4 O D. not meaningful (d) Predict the value of y for x4.5. Choose the correct answer below. O A. 61.2 O B. 48.9 O C. 112.8 O D. not meaningful

Functions and Change: A Modeling Approach to College Algebra (MindTap Course List)
6th Edition
ISBN:9781337111348
Author:Bruce Crauder, Benny Evans, Alan Noell
Publisher:Bruce Crauder, Benny Evans, Alan Noell
Chapter3: Straight Lines And Linear Functions
Section3.CR: Chapter Review Exercises
Problem 16CR: XYZ Corporation Stock Prices The following table shows the average stock price, in dollars, of XYZ...

Related questions
Question
100%
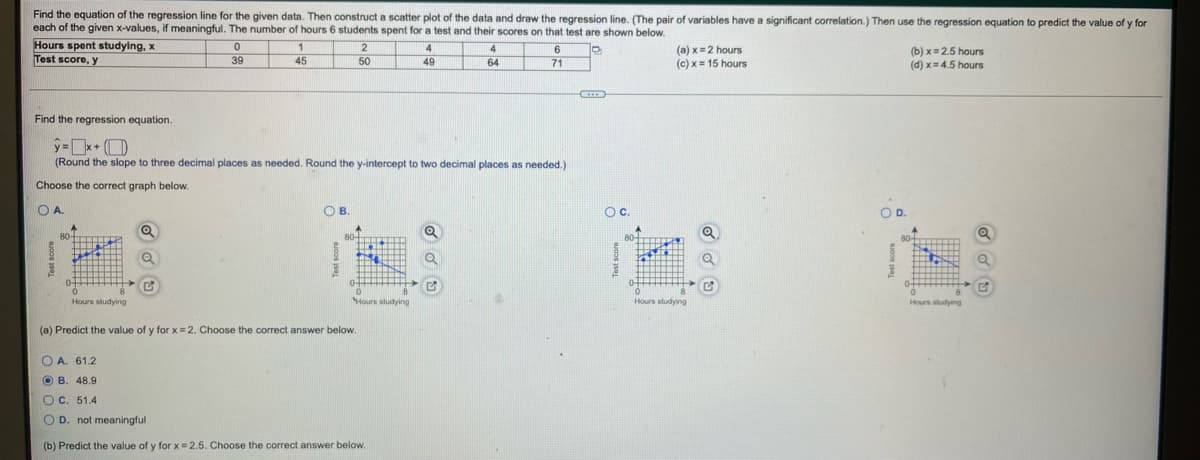
Transcribed Image Text:Find the equation of the regression line for the given data. Then construct a scatter plot of the data and draw the regression line. (The pair of variables have a significant correlation.) Then use the regression equation to predict the value of y for
each of the given x-values, if meaningful. The number of hours 6 students spent for a test and their scores on that test are shown below.
Hours spent studying, x
Test score, y
4
(a) x=2 hours
(c) x= 15 hours
4
6
(b) x= 2.5 hours
(d) x= 4.5 hours
39
45
50
49
64
71
Find the regression equation.
(Round the slope to three decimal places as needed. Round the y-intercept to two decimal places as needed.)
Choose the correct graph below.
OD.
A.
O
B.
Oc.
80-
80-
Hours studying
Nours studying
Hours studying
Hours studying
(a) Predict the value of y for x=2. Choose the correct answer below.
O A. 61.2
O B. 48.9
O C. 51.4
O D. not meaningful
(b) Predict the value of y for x =2.5. Choose the correct answer below.
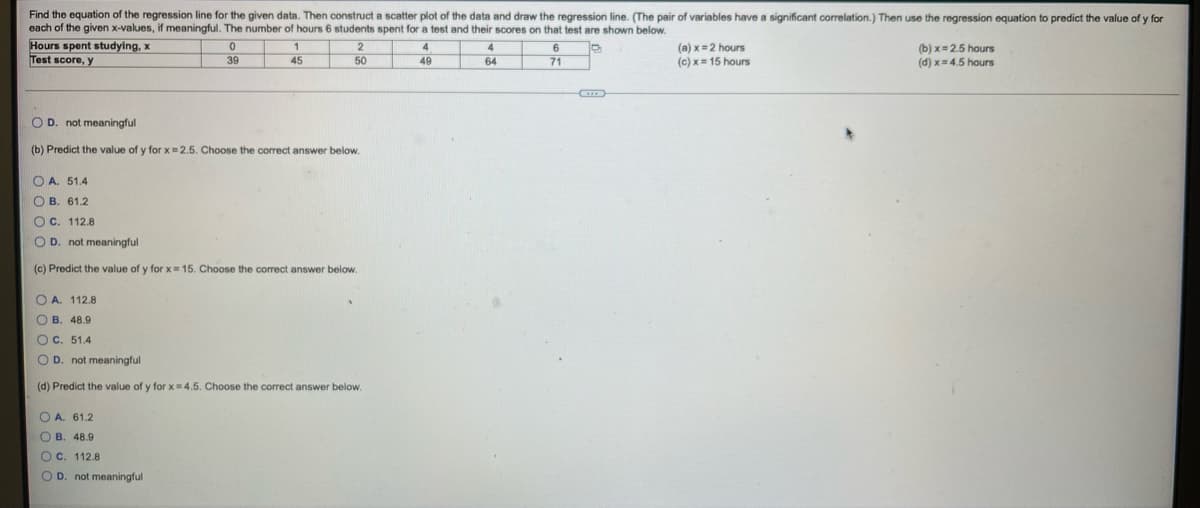
Transcribed Image Text:Find the equation of the regression line for the given data. Then construct a scatter plot of the data and draw the regression line. (The pair of variables have a significant correlation.) Then use the regression equation to predict the value of y for
each of the given x-values, if meaningful. The number of hours 6 students spent for a test and their scores on that test are shown below.
Hours spent studying, x
Test score, y
4
49
(a) x=2 hours
(c) x= 15 hours
(b) x= 2.5 hours
(d) x= 4.5 hours
39
45
50
64
71
O D. not meaningful
(b) Predict the value of y for x=2.5. Choose the correct answer below.
O A. 51.4
O B. 61.2
OC. 112.8
O D. not meaningful
(c) Predict the value of y for x= 15. Choose the correct answer below.
O A. 112.8
O B. 48.9
OC. 51.4
O D. not meaningful
(d) Predict the value of y for x= 4.5. Choose the correct answer below.
O A. 61.2
O B. 48.9
O C. 112.8
O D. not meaningful
Expert Solution
This question has been solved!
Explore an expertly crafted, step-by-step solution for a thorough understanding of key concepts.

Step by step
Solved in 3 steps with 3 images

Recommended textbooks for you
Functions and Change: A Modeling Approach to Coll…
Algebra
ISBN:
9781337111348
Author:
Bruce Crauder, Benny Evans, Alan Noell
Publisher:
Cengage Learning

Algebra and Trigonometry (MindTap Course List)
Algebra
ISBN:
9781305071742
Author:
James Stewart, Lothar Redlin, Saleem Watson
Publisher:
Cengage Learning

Glencoe Algebra 1, Student Edition, 9780079039897…
Algebra
ISBN:
9780079039897
Author:
Carter
Publisher:
McGraw Hill
Functions and Change: A Modeling Approach to Coll…
Algebra
ISBN:
9781337111348
Author:
Bruce Crauder, Benny Evans, Alan Noell
Publisher:
Cengage Learning
Algebra and Trigonometry (MindTap Course List)
Algebra
ISBN:
9781305071742
Author:
James Stewart, Lothar Redlin, Saleem Watson
Publisher:
Cengage Learning
Glencoe Algebra 1, Student Edition, 9780079039897…
Algebra
ISBN:
9780079039897
Author:
Carter
Publisher:
McGraw Hill

College Algebra
Algebra
ISBN:
9781305115545
Author:
James Stewart, Lothar Redlin, Saleem Watson
Publisher:
Cengage Learning
