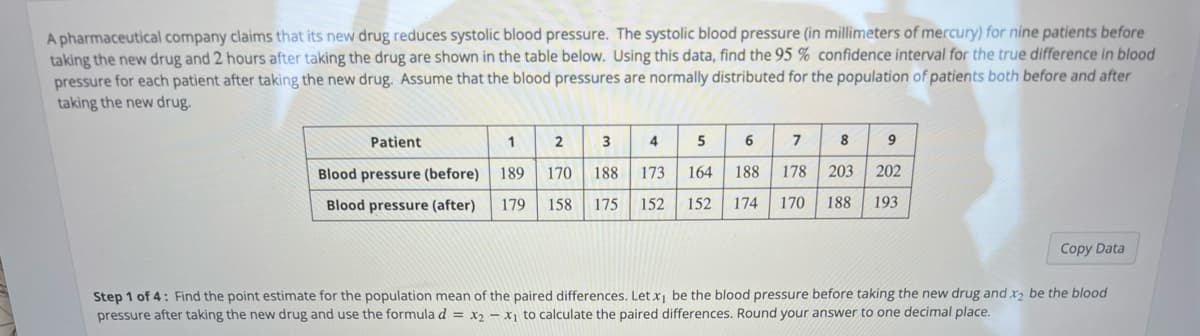
A pharmaceutical company claims that its new drug reduces systolic blood pressure. The systolic blood pressure (in millimeters of mercury) for nine patients before taking the new drug and 2 hours after taking the drug are shown in the table below. Using this data, find the 95 % confidence interval for the true difference in blood pressure for each patient after taking the new drug. Assume that the blood pressures are normally distributed for the population of patients both before and after taking the new drug. 2 3 Patient 1 4 5 6 7 8 9. Blood pressure (before) 189 170 188 173 164 188 178 203 202 Blood pressure (after) 179 158 175 152 152 174 170 188 193 Copy Data Step 1 of 4: Find the point estimate for the population mean of the paired differences. Let x¡ be the blood pressure before taking the new drug and x, be the blood pressure after taking the new drug and use the formula d = x2 - x to calculate the paired differences. Round your answer to one decimal place.
A pharmaceutical company claims that its new drug reduces systolic blood pressure. The systolic blood pressure (in millimeters of mercury) for nine patients before taking the new drug and 2 hours after taking the drug are shown in the table below. Using this data, find the 95 % confidence interval for the true difference in blood pressure for each patient after taking the new drug. Assume that the blood pressures are normally distributed for the population of patients both before and after taking the new drug. 2 3 Patient 1 4 5 6 7 8 9. Blood pressure (before) 189 170 188 173 164 188 178 203 202 Blood pressure (after) 179 158 175 152 152 174 170 188 193 Copy Data Step 1 of 4: Find the point estimate for the population mean of the paired differences. Let x¡ be the blood pressure before taking the new drug and x, be the blood pressure after taking the new drug and use the formula d = x2 - x to calculate the paired differences. Round your answer to one decimal place.

MATLAB: An Introduction with Applications
6th Edition
ISBN:9781119256830
Author:Amos Gilat
Publisher:Amos Gilat
Chapter1: Starting With Matlab
Section: Chapter Questions
Problem 1P

Related questions
Question
100%
Steps 2 out of 4: calculate the sample standard deviation of the paired differences. Round to 6 decimals places
Steps 3 out of 4: calculate the margin of error to be used in constructing the confidence interval.
Steps 4 out of 4: construct 95% confidence interval
Transcribed Image Text:A pharmaceutical company claims that its new drug reduces systolic blood pressure. The systolic blood pressure (in millimeters of mercury) for nine patients before
taking the new drug and 2 hours after taking the drug are shown in the table below. Using this data, find the 95 % confidence interval for the true difference in blood
pressure for each patient after taking the new drug. Assume that the blood pressures are normally distributed for the population of patients both before and after
taking the new drug.
Patient
1
2
3
4
5
8
9
Blood pressure (before)
189
170
188
173
164
188
178
203
202
Blood pressure (after)
179
158
175
152
152
174
170
188
193
Copy Data
Step 1 of 4: Find the point estimate for the population mean of the paired differences. Let x¡ be the blood pressure before taking the new drug and x2 be the blood
pressure after taking the new drug and use the formulad = x, – x to calculate the paired differences. Round your answer to one decimal place.
Expert Solution
This question has been solved!
Explore an expertly crafted, step-by-step solution for a thorough understanding of key concepts.

Step by step
Solved in 4 steps with 3 images

Recommended textbooks for you
MATLAB: An Introduction with Applications
Statistics
ISBN:
9781119256830
Author:
Amos Gilat
Publisher:
John Wiley & Sons Inc

Probability and Statistics for Engineering and th…
Statistics
ISBN:
9781305251809
Author:
Jay L. Devore
Publisher:
Cengage Learning

Statistics for The Behavioral Sciences (MindTap C…
Statistics
ISBN:
9781305504912
Author:
Frederick J Gravetter, Larry B. Wallnau
Publisher:
Cengage Learning
MATLAB: An Introduction with Applications
Statistics
ISBN:
9781119256830
Author:
Amos Gilat
Publisher:
John Wiley & Sons Inc
Probability and Statistics for Engineering and th…
Statistics
ISBN:
9781305251809
Author:
Jay L. Devore
Publisher:
Cengage Learning
Statistics for The Behavioral Sciences (MindTap C…
Statistics
ISBN:
9781305504912
Author:
Frederick J Gravetter, Larry B. Wallnau
Publisher:
Cengage Learning

Elementary Statistics: Picturing the World (7th E…
Statistics
ISBN:
9780134683416
Author:
Ron Larson, Betsy Farber
Publisher:
PEARSON

The Basic Practice of Statistics
Statistics
ISBN:
9781319042578
Author:
David S. Moore, William I. Notz, Michael A. Fligner
Publisher:
W. H. Freeman

Introduction to the Practice of Statistics
Statistics
ISBN:
9781319013387
Author:
David S. Moore, George P. McCabe, Bruce A. Craig
Publisher:
W. H. Freeman