Find the equation of the regression line for the given data. Then construct a scatter plot of the data and draw the regression line. (Each pair of variables has a significant correlation.) Then use the regression equation to predict the value of y for each of the given x-values, if meaningful. The caloric content and the sodium content (in milligrams) for 6 beef hot dogs are shown in the table below. Calories x 170 130 130 90 180 O (a) x= 180 calories (b) x= 100 calories 160
Find the equation of the regression line for the given data. Then construct a scatter plot of the data and draw the regression line. (Each pair of variables has a significant correlation.) Then use the regression equation to predict the value of y for each of the given x-values, if meaningful. The caloric content and the sodium content (in milligrams) for 6 beef hot dogs are shown in the table below. Calories x 170 130 130 90 180 O (a) x= 180 calories (b) x= 100 calories 160

Functions and Change: A Modeling Approach to College Algebra (MindTap Course List)
6th Edition
ISBN:9781337111348
Author:Bruce Crauder, Benny Evans, Alan Noell
Publisher:Bruce Crauder, Benny Evans, Alan Noell
Chapter3: Straight Lines And Linear Functions
Section3.CR: Chapter Review Exercises
Problem 15CR: Life Expectancy The following table shows the average life expectancy, in years, of a child born in...

Related questions
Question
Answer these questions
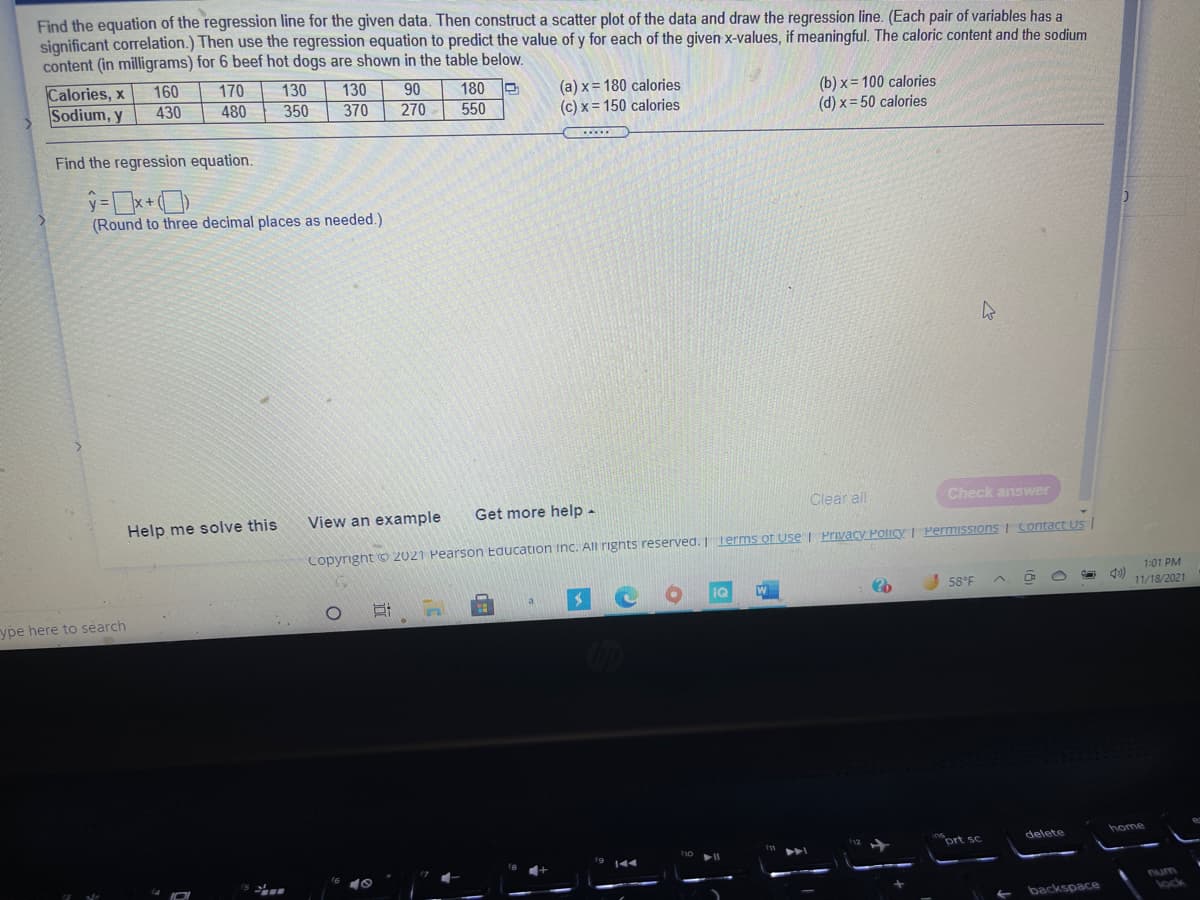
Transcribed Image Text:Find the equation of the regression line for the given data. Then construct a scatter plot of the data and draw the regression line. (Each pair of variables has a
significant correlation.) Then use the regression equation to predict the value of y for each of the given x-values, if meaningful. The caloric content and the sodium
content (in milligrams) for 6 beef hot dogs are shown in the table below.
Calories, x
Sodium, y
160
430
170
130
350
130
90
180
550
(a) x = 180 calories
(c) x = 150 calories
(b) x= 100 calories
(d) x= 50 calories
480
370
270
Find the regression equation.
(Round to three decimal places as needed.)
Get more help -
Clear all
Check answer
Help me solve this
View an example
Copyright O 2021 Pearson Education Inc. All righnts reserved.T Terms of Use I Privacy Policy I Permissions I Sontact Us
1:01 PM
58°F
11/18/2021
ype here to search
ort sc
delete
home
num
backspace
lock
Expert Solution
This question has been solved!
Explore an expertly crafted, step-by-step solution for a thorough understanding of key concepts.

Step by step
Solved in 3 steps with 1 images

Recommended textbooks for you
Functions and Change: A Modeling Approach to Coll…
Algebra
ISBN:
9781337111348
Author:
Bruce Crauder, Benny Evans, Alan Noell
Publisher:
Cengage Learning

Glencoe Algebra 1, Student Edition, 9780079039897…
Algebra
ISBN:
9780079039897
Author:
Carter
Publisher:
McGraw Hill

Elementary Linear Algebra (MindTap Course List)
Algebra
ISBN:
9781305658004
Author:
Ron Larson
Publisher:
Cengage Learning
Functions and Change: A Modeling Approach to Coll…
Algebra
ISBN:
9781337111348
Author:
Bruce Crauder, Benny Evans, Alan Noell
Publisher:
Cengage Learning
Glencoe Algebra 1, Student Edition, 9780079039897…
Algebra
ISBN:
9780079039897
Author:
Carter
Publisher:
McGraw Hill
Elementary Linear Algebra (MindTap Course List)
Algebra
ISBN:
9781305658004
Author:
Ron Larson
Publisher:
Cengage Learning


Algebra and Trigonometry (MindTap Course List)
Algebra
ISBN:
9781305071742
Author:
James Stewart, Lothar Redlin, Saleem Watson
Publisher:
Cengage Learning