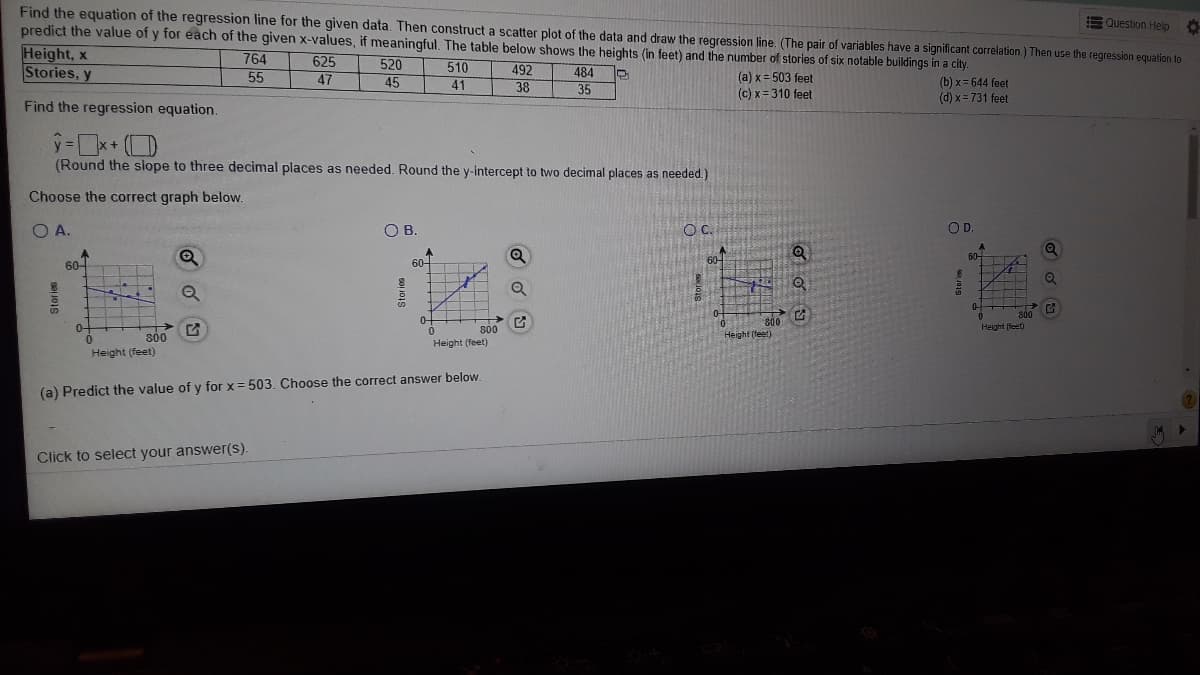
Find the equation of the regression line for the given data. Then construct a scatter plot of the data and draw the regression line. (The pair of variables have a significant correlation ) Then use the regression equation to Question Help predict the value of y for each of the given x-values, if meaningful. The table below shows the heights (in feet) and the number of stories of six notable buildings in a city. Height, x Stories, y 764 55 625 520 45 510 41 492 484 35 (a) x= 503 feet (c) x = 310 feet 47 (b) x= 644 feet (d) x = 731 feet 38 Find the regression equation. !3! (Round the slope to three decimal places as needed. Round the y-intercept to two decimal places as needed.) Choose the correct graph below. O A. OB. Oc. OD. 60- 60- 60 60- of 800 G Height (teet) 300 0- 0. 0- 800 Height (feet) 800 Height (feet) Height (feet) (a) Predict the value of y for x = 503. Choose the correct answer below. Click to select your answer(S).

Big Ideas Math A Bridge To Success Algebra 1: Student Edition 2015
1st Edition
ISBN:9781680331141
Author:HOUGHTON MIFFLIN HARCOURT
Publisher:HOUGHTON MIFFLIN HARCOURT
Chapter4: Writing Linear Equations
Section4.5: Analyzing Lines Of Fit
Problem 31E
icon
Related questions
icon
Concept explainers
Question
Find the equation of the regression line for the given data. Then construct a scatter plot of the data and draw the regression line. (The pair of variables have a significant correlation) Then use the regression equation to
predict the value of y for each of the given x-values, if meaningful. The table below shows the heights (in feet) and the number of stories of six notable buildings in a city.
E Question Help
Height, x
Stories, y
764
55
625
47
520
45
510
492
38
484
35
(a) x= 503 feet
(c) x= 310 feet
(b) x = 644 feet
(d) x = 731 feet
41
Find the regression equation.
(Round the slope to three decimal places as needed. Round the y-intercept to two decimal places as needed.)
Choose the correct graph below.
O A.
O B.
OC.
OD.
60-
60-
60-
60-
10
800
0-
800
Height (feet)
800
Height fieet)
800 C
Height (feet)
Height (feet)
(a) Predict the value of y for x = 503. Choose the correct answer below.
Click to select your answer(S).
Transcribed Image Text:Find the equation of the regression line for the given data. Then construct a scatter plot of the data and draw the regression line. (The pair of variables have a significant correlation) Then use the regression equation to predict the value of y for each of the given x-values, if meaningful. The table below shows the heights (in feet) and the number of stories of six notable buildings in a city. E Question Help Height, x Stories, y 764 55 625 47 520 45 510 492 38 484 35 (a) x= 503 feet (c) x= 310 feet (b) x = 644 feet (d) x = 731 feet 41 Find the regression equation. (Round the slope to three decimal places as needed. Round the y-intercept to two decimal places as needed.) Choose the correct graph below. O A. O B. OC. OD. 60- 60- 60- 60- 10 800 0- 800 Height (feet) 800 Height fieet) 800 C Height (feet) Height (feet) (a) Predict the value of y for x = 503. Choose the correct answer below. Click to select your answer(S).
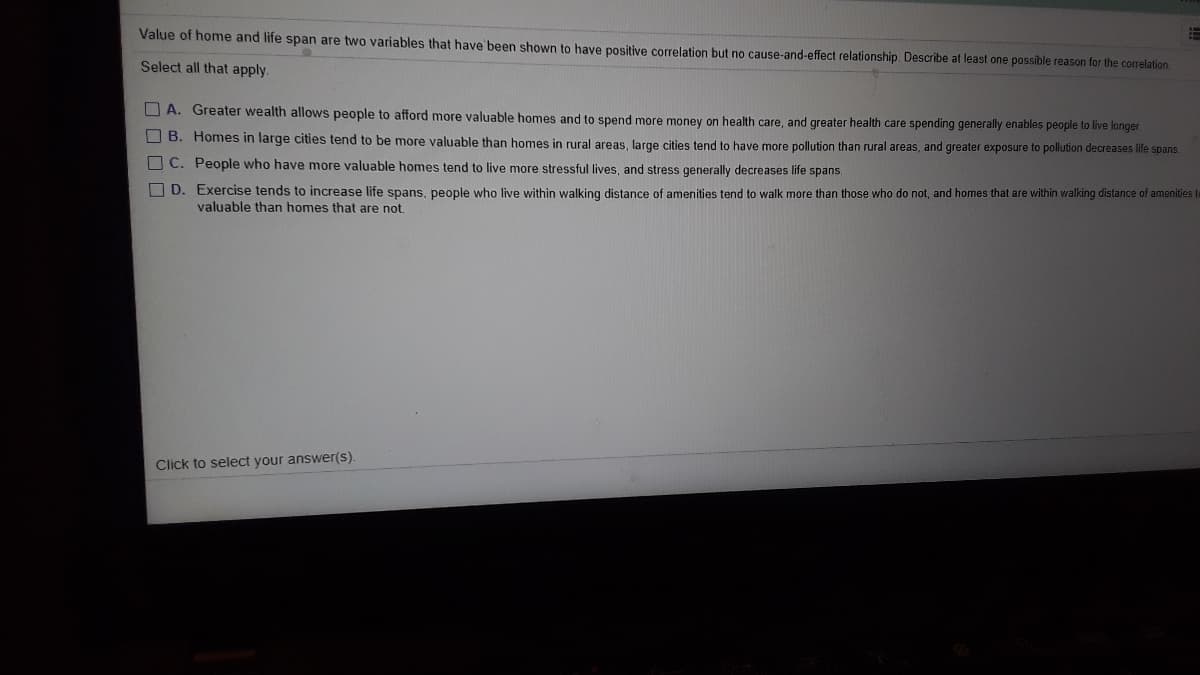
Value of home and life span are two variables that have been shown to have positive correlation but no cause-and-effect relationship. Describe at least one possible reason for the correlation
Select all that apply.
O A. Greater wealth allows people to afford more valuable homes and to spend more money on health care, and greater health care spending generally enables people to live longer
B. Homes in large cities tend to be more valuable than homes in rural areas, large cities tend to have more pollution than rural areas, and greater exposure to pollution decreases life spans.
C. People who have more valuable homes tend to live more stressful lives, and stress generally decreases life spans.
O D. Exercise tends to increase life spans, people who live within walking distance of amenities tend to walk more than those who do not, and homes that are within walking distance of amenities te
valuable than homes that are not.
Click to select your answer(s).
O O O
Transcribed Image Text:Value of home and life span are two variables that have been shown to have positive correlation but no cause-and-effect relationship. Describe at least one possible reason for the correlation Select all that apply. O A. Greater wealth allows people to afford more valuable homes and to spend more money on health care, and greater health care spending generally enables people to live longer B. Homes in large cities tend to be more valuable than homes in rural areas, large cities tend to have more pollution than rural areas, and greater exposure to pollution decreases life spans. C. People who have more valuable homes tend to live more stressful lives, and stress generally decreases life spans. O D. Exercise tends to increase life spans, people who live within walking distance of amenities tend to walk more than those who do not, and homes that are within walking distance of amenities te valuable than homes that are not. Click to select your answer(s). O O O
Expert Solution
trending now

Trending now

This is a popular solution!

steps

Step by step

Solved in 2 steps with 3 images

Blurred answer
Knowledge Booster
Correlation, Regression, and Association
Learn more about
Need a deep-dive on the concept behind this application? Look no further. Learn more about this topic, statistics and related others by exploring similar questions and additional content below.
Recommended textbooks for you
Big Ideas Math A Bridge To Success Algebra 1: Stu…
Algebra
ISBN:
9781680331141
Author:
HOUGHTON MIFFLIN HARCOURT
Publisher:
Houghton Mifflin Harcourt
Glencoe Algebra 1, Student Edition, 9780079039897…
Algebra
ISBN:
9780079039897
Author:
Carter
Publisher:
McGraw Hill
Algebra and Trigonometry (MindTap Course List)
Algebra
ISBN:
9781305071742
Author:
James Stewart, Lothar Redlin, Saleem Watson
Publisher:
Cengage Learning