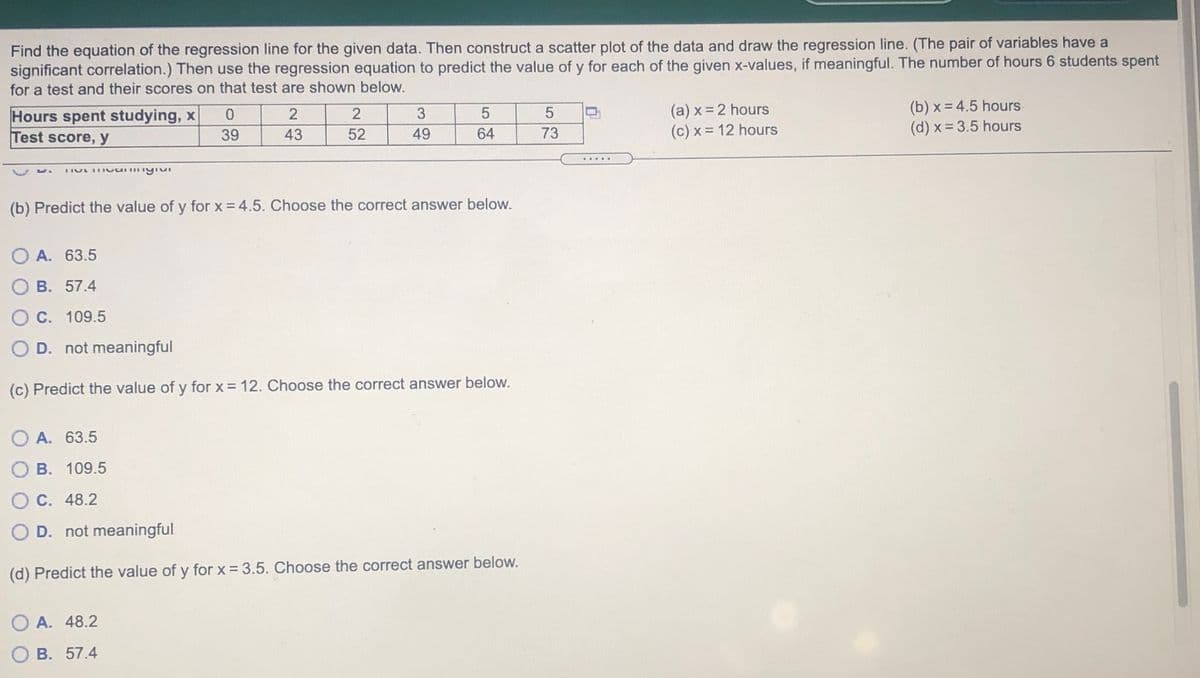
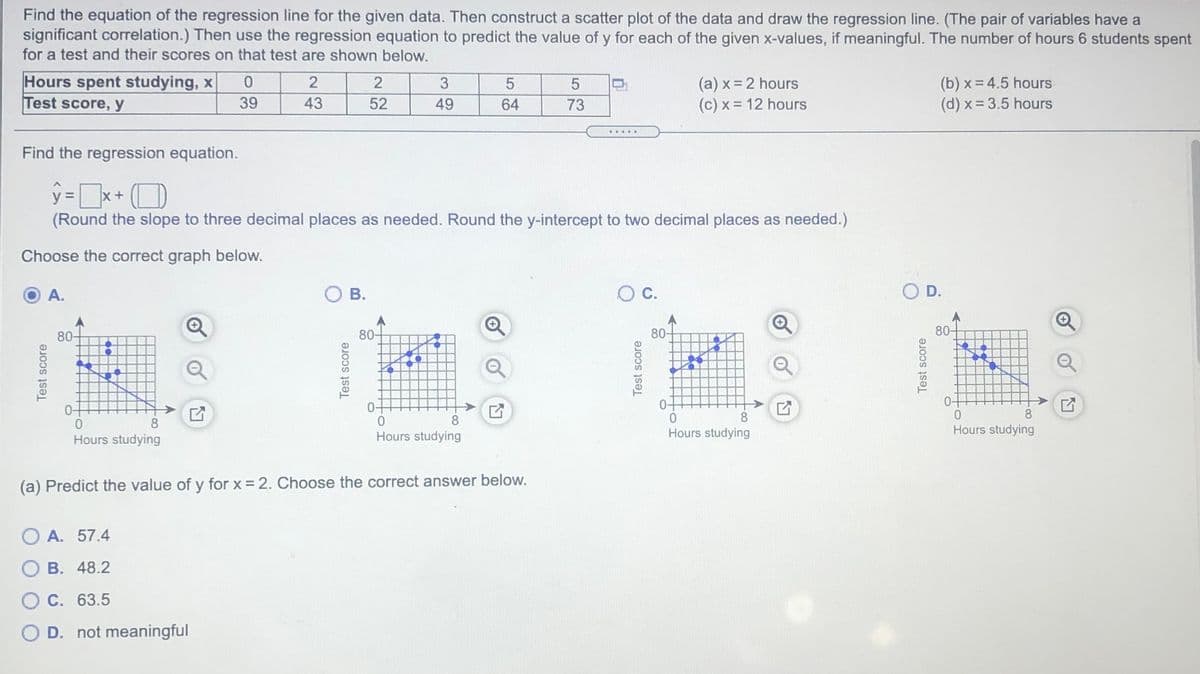
Find the equation of the regression line for the given data. Then construct a scatter plot of the data and draw the regression line. (The pair of variables have a significant correlation.) Then use the regression equation to predict the value of y for each of the given x-values, if meaningful. The number of hours 6 students spe for a test and their scores on that test are shown below. Hours spent studying, x (a) x = 2 hours (b) x = 4.5 hours 3 5 (c) x= 12 hours (d) x = 3.5 hours 10 アク


Unitary Method
The word “unitary” comes from the word “unit”, which means a single and complete entity. In this method, we find the value of a unit product from the given number of products, and then we solve for the other number of products.
Speed, Time, and Distance
Imagine you and 3 of your friends are planning to go to the playground at 6 in the evening. Your house is one mile away from the playground and one of your friends named Jim must start at 5 pm to reach the playground by walk. The other two friends are 3 miles away.
Profit and Loss
The amount earned or lost on the sale of one or more items is referred to as the profit or loss on that item.
Units and Measurements
Measurements and comparisons are the foundation of science and engineering. We, therefore, need rules that tell us how things are measured and compared. For these measurements and comparisons, we perform certain experiments, and we will need the experiments to set up the devices.
can you show me how to work this problem don't understand it


Trending now
This is a popular solution!

Step by step
Solved in 2 steps with 1 images


