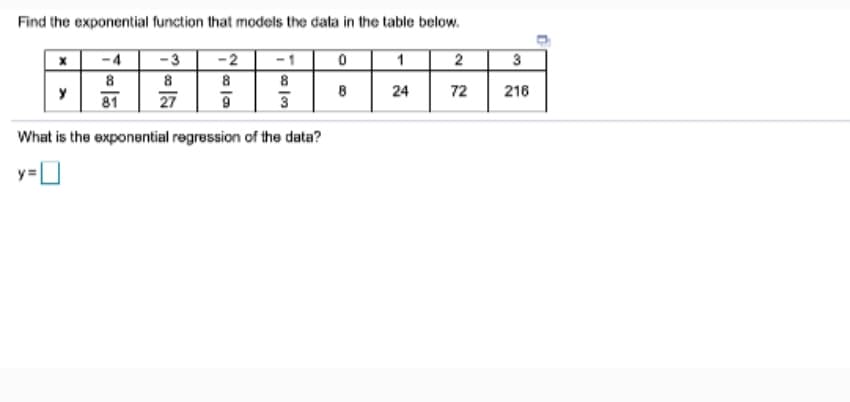
Find the exponential function that models the data in the table below. -4 -3 -2 2 3 8 8. y 8 24 72 216 81 27 What is the exponential regression of the data? y=]


Q: 2. The data shown in the table below represents either a linear or an exponential function. Which of…
A: hello i am here to help you
Q: 6 Jean invested $380 in stocks. Over the next 5 years, the value of her investment grew, as shown in…
A:
Q: Determine the exponential regression of the data below using either a calculator or spreadsheet…
A: Given that
Q: Hours (x) Bacteria (y) 0 1853 1 2221 2 2714 3 3056 4 4078
A:
Q: Salicylate is active in aspirin. The following table shows the amount of salicylate in the…
A:
Q: 5. P(t)723 1225.78 1853 2467.6 2942.68 3246.96 3419.05 3509.59 3555.42 The table is given by…
A:
Q: The questions below can be answered using the tables or the regression equations found in the…
A: Note: Hey there! Thank you for the question. As you have posted multiple questions, we have helped…
Q: The table to the right shows the number of internet hosts from 1994 to 2012. (A) Let x represent…
A: Introduction: We need to fit the exponential regression model of the form y = abx to the data set,…
Q: 1 3 4 5 y 1118 1760 2514 3696 5714 8401 Use regression to find an exponential equation that best…
A:
Q: x 1 2 3 4 5 6 y 535 581 571 620 633 610 Use exponential regression to find an exponential function…
A: Exponential regression model: Steps to construct scatter plot in Excel: Enter the data for X and Y…
Q: 1 2 4 6. y 784 996 1328 1650 2200 3054 Use regression to find an exponential equation that best fits…
A:
Q: 5. Use the two tables below. 1 2 3 f(x) 4 2 1 0.5 Which table of data is linear and which is…
A: Solve the following
Q: 1 4 y 845 1396 2114 3362 5506 8159 Use exponential regression to find an exponential function that…
A: We have to plot the given data on Excel Spreadsheet to generate the best fit function of this data.…
Q: Identify the form and direction, if appropriate, of the relationship of the data in the table below.…
A: Given information: The data represents the values of the variables x and y.
Q: For this exercise, round all regression parameters to three decimal places. The table below shows…
A: To solve the given statements
Q: The following table shows an exponential model: t 4 8. 12 16 g(t) 38.30 28.65 21.43 16.04 11.99 Does…
A: Given, t 0 4 8 12 16 g(t) 38.30 28.65 21.43 16.04 11.99
Q: 4. The table below shows the concentration of ozone in Earth's atmosphere at different altitudes.…
A:
Q: Find the exponential function that models the data in the table below.…
A: Steps to construct scatter plot in Excel: Enter the data for X and Y in Excel sheet>Select the…
Q: Use exponential regression to find the value of y when x = 50. Round your answer to the nearest…
A: So, y will be a function of x, of form y = a*ebx + c where a, b and c are some constants , and…
Q: Use exponential regression to fit the data set. (Round your answers to three decimal places.) x 1…
A: Given that the data sets are x 1 2 3 4 5 y 53 55.2 57.4 59.7 62
Q: algebra question
A: Consider the given table
Q: 1 2 3 4 y 772 1074 1568 2053 3001 3926 Use regression to find an exponential equation that best fits…
A:
Q: 7. The decennial population of Center City for the past five decades is shown in the table below.…
A: Let x and y be the year and age respectively. The exponential regression for Population(y) on…
Q: 1 4 5 6. y 1172 1971 3246 5558 8362 14766 Use regression to find an exponential equation that best…
A: The given problem is to find the best fit curve of the exponential function y=abx with the given…
Q: A bacteria sample is growing exponentially, as a seen in the table below. Hours since observation…
A: Let hourse since observation began be x and number of bacteria sample be y.
Q: (A) Write the regression equation y = abx y = ___ x ___x (B) In the exponential equation y = ____…
A: Step by step procedure to find the regression equation using MINITAB: Choose Stat > Time Series…
Q: Find an exponential regression for the data above:
A: Given, Year Price($) 2001 5.66 2002 5.81 2003 6.03 2004 6.21 2005 6.41 2006 6.55…
Q: 4. The height of a sunflower was recorded every seven days as it grew. Day 7 14 21 28 35 42 Height…
A: Given is the data for the height of a sunflower that was recorded for every 7 day as it grew. The…
Q: Use exponential regression to fit the data set. (Round your answers to two decimal places.) x 1 2…
A: Use exponential regression to fit the data set. (Round your answers to two decimal places.) x 1…
Q: People in the United States are drinking less of a certain juice than they have in the past. years…
A: Use the given data to form the excel table: X Y Y2 ln y ln y2 0 10.5 110.25 2.351375257…
Q: The accompanying table shows the value of a car over time that was purchased for 18600 dollars,…
A:
Q: 1 6. 952 1134 1406 1849 2075 2817 y (a) Use data above to determine an exponential regression…
A: the trend line is: Y= 752.15*(1.24^x)
Q: X y 1 2 621 683 3 4 822 861 Use exponential regression to find an exponential function that best…
A: We need to determine the exponential equation and linear equation that best fits the data. We also…
Q: Use the data below to determine the exponential regression for the population of a large town. Round…
A: The exponential regression equation can be obtained using excel. Enter the data into excel sheet.…
Q: The accompanying table shows the value of a car over time that was purchased for 14100 dollars,…
A: Given: Years (X) Values in dollar (Y) 0 14100 1 13009 2…
Q: For this exercise, round all regression parameters to three decimal places. The following table…
A: The exponential growth model is defined as, P = a(1 + r)t, where a is the initial amount, r is the…
Q: 2. 3 4 5 y 644 742 916 1119 1354 1590 Use regression to find an exponential equation that best fits…
A:
Q: 2 3| 4 y 1023 1313 1901 2537 3747| 5055 1|| 5 6 Use regression to find an exponential equation that…
A: Given, The table is shown below :
Q: Write an exponential regression equation for the following data, rounding all coefficients to the…
A: Solution: The curve to be fitted is y=aebx taking logarithm on both sides, we get…
Q: 11. The table shows the temperature of coffee (in Fahrenheit) as a function of the number of minutes…
A: In exponential regression model, the standard form of equation is, where y is the response variable…
Q: Find the exponential function that models the data in the table below. - 3 - 2 - 1 1 2 3 4 4 y 4 12…
A: Given a dataset where an exponential function y=abx where a and b are constants. are to be obtained.…
Q: the regression line predicting the relation of age to the calories burnt ey =6.08+0.942x . Predict…
A: Given regression equation is y=6.08+0.942x If x=55 then y=?
Q: Owen invested $2 000 three years ago. He has been tracking the investment by recording its value at…
A:
Q: 5. Use regression to determine an exponential model for the following data. Round all parameters to…
A: Regression is used for prediction purpose. equation of line of regression is y= a+bx where y is…
Q: The accompanying table shows the number of bacteria present in a certain culture over a 4 hour…
A: Thank you for posting the question. Since you have asked multiple question, we will solve the first…
Q: 9. Cell Phones The following table shows the num- ber, in millions, of cell phone subscribers in the…
A: Image is attached with detailed solution.
Q: The table gives the population of the United States, in millions, for the years 1900-2000. Use a…
A: Given that a table which gives the population of the United states in millions for the years…
Q: A regression was run to determine if there is a relationship between the happiness index (y) and…
A: Solution : Given : Y : Happiness index x: Life expectancy and Y= -1.778+0.143x d) If…
Q: 82 44 F 80 40 80 40 H. 79 38 74 28 70 60 's use basic stats to create regression equation (which we…
A: The given data set is: x y 100 80 93 66 90 19 86 52 82 44 80…
Q: Write an exponential regression equation for the following data, rounding all coefficients to the…
A: Given the data, x 3 6 10 14 17 21 23 y 475 402 321 243 193 153 140 To find: The exponential…


Trending now
This is a popular solution!

Step by step
Solved in 3 steps


- Special Rounding Instructions For this exercise set, round all regression parameters to three decimal places, but round all other answers to two decimal places unless otherwise indicated. Rare Coins The table below shows the estimated value C, in dollars, of an 1877 Indian Head Cent Philadelphia mint mark in very fine condition t years after 1950. t=time,inyearssince1950 C=value,indollars 0 25 30 400 45 625 54 1750 60 2000 a.Use exponential regression to model C as an exponential function of t. b.According to your exponential model, by what percentage does the value of the 1877 cent increase from year to year?World Population The following table shows world population N, in billions, in the given year. Year 1950 1960 1970 1980 1990 2000 2010 N 2.56 3.04 3.71 4.45 5.29 6.09 6.85 a. Use regression to find a logistic model for world population. b. What r value do these data yield for humans on planet Earth? c. According to the logistic model using these data, what is the carrying capacity of planet Earth for humans? d. According to this model, when will world population reach 90 of carrying capacity? Round to the nearest year. Note: This represents a rather naive analysis of world population.Special Rounding Instructions For this exercise set, round all regression parameters to three decimal places, but round all other answers to two decimal places unless otherwise indicated. Cell phones The following table shows the number, in millions, of cell phone subscribers in the United States at the end of the given year. Year Subscribersmillions 2010 296.3 2011 316.0 2012 326.5 2013 335.6 2014 355.4 a.Plot the data points. b.Use exponential regression to construct an exponential model for the subscriber data. c.Add the graph of the exponential model to the plot in part a. d.What was the yearly percentage growth rate from the end of 2010 through the end of 2014 for cell phone subscribership? e.In 2014, an executive had a plan that could make money for the company, provided that there would be at least 380million cell phone subscribers by the end of 2016. Solely on the basis of an exponential model for the data in the table, would it be reasonable for the executive to implement the plan?
- The table shows the mid-year populations (in millions) of five countries in 2015 and the projected populations (in millions) for the year 2025. (a) Find the exponential growth or decay model y=aebt or y=aebt for the population of each country by letting t=15 correspond to 2015. Use the model to predict the population of each country in 2035. (b) You can see that the populations of the United States and the United Kingdom are growing at different rates. What constant in the equation y=aebt gives the growth rate? Discuss the relationship between the different growth rates and the magnitude of the constant.Special Rounding Instructions For this exercise set, round all regression parameters to three decimal places, but round all other answers to two decimal places unless otherwise indicated. Cost of Scientific periodicals The table below shows the average cost C, in dollars, of chemistry and physics periodicals tyears after 1980. 29 t=yearssince1980 C=cost,indollars 0 140 5 250 10 410 15 780 20 1300 22 1520 a.Make an exponential model of C as a function of t. b.Plot the data and the exponential model. c.What was the yearly percentage growth rate of the cost of chemistry and physics periodicals? d.If this exponential trend continues, what will be the expected average cost of physics and chemistry periodicals in 2020? Round your answer to the nearest dollar.Special Rounding Instructions For this exercise set, round all regression parameters to three decimal places, but round all other answers to two decimal places unless otherwise indicated. Design Patents The following table shows the number P of design patents awarded by the U.S. Patents and Trademark Office from 1950 through 2010. t = years since 1950 P = patents 0 4718 10 2543 20 3214 30 3949 40 8024 50 17,413 60 22,799 a.Use exponential regression to model P as a function of t. b.Plot the data along with the regression equation. c.In what years were there more patents awarded than might be expected from the model?
- Special Rounding Instructions For this exercise set, round all regression parameters to three decimal places, but round all other answers to two decimal places unless otherwise indicated. Medicare ExpendituresThe following table is from the Centers for Medicare that is, M=1000?The function f(x)=ex is called the___________ Exponential function. The number eis approximately equal to________.Suppose that the initial size of a population is n0 and the population grows exponentially. Let n(t) be the size of the population at time t. (a) Write a formula for n(t) in terms of the doubling time a. (b) Write a formula for n(t) in terms of the relative growth rate r.


